Category Archives: LAB

INTERPRETATION OF CONCRETE IN-SITU TEST RESULTS FOR STRENGTH STRENGTH ASSESSMENT

CIVIL_ENGINEERING

Concrete in-situ test results interpretation is important for structural strength assessment. Concrete test results interpretation consists of three stages from which proper conclusion are developed and its applications is discussed.

In this article, different steps of result of concrete in-sit tests are discussed.
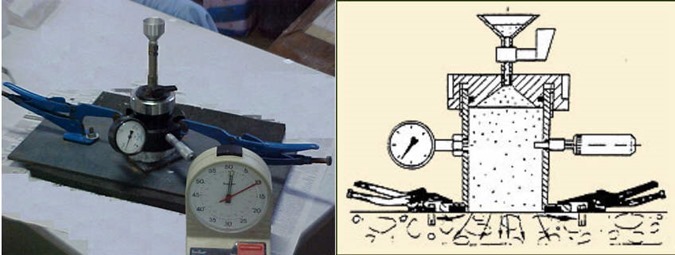
Interpretation of Concrete In-Situ Tests Results

Interpretation of Concrete In-Situ Test Results

  • Computation of in-situ concrete test results
  • Examination of variability of results of in-situ concrete tests
  • Calibration and/or application of in-situ concrete test results

Computation of Concrete In-Situ Test Results

Concrete in-situ test methods, which follow clear procedure, affect the amount of computation needed to provide suitable parameters at test locations. For instance, concrete core test should be corrected for length, orientation and reinforcement to yield equivalent cube strength.

Tests on concrete such as penetration resistance, pull out, and surface hardness have to be averaged to obtained mean value. At this stage, only direct measurement properties should be concentrated on and attempts to create correlation with other property other must be avoided.

Chemical and similar tests on concrete is assessed to produce suitable parameters such as cement content or proportions of mixture. Load tests are commonly expressed in the form of load / deflection curves with moments estimated for critical conditions.

Concrete In-Situ Tests

Examination of Variability of Concrete In-Situ Test Results

In cases where more than one test results are available, important and valuable information can be obtained by comparing different result. Whenever small numbers of variable results are available, such as in the case of load test, they provide an indication about construction uniformity and consequently the importance of the concrete test results.

However, when large quantity of variable results is obtained for example in non-destructive testing, examining those results can show areas of delaying quality.

This information combined with knowledge of test method variability give a measure of the utilized construction standards and controls. There are numbers of techniques used to examine enormous number of variable results:

Graphical Methods of Concrete Test Results Examination

In graphical methods, contours are used to show details such as areas of equal strength and indicate zones of exceptionally high strength and low strength from other parts of the member. Not only do contours beneficial to strength evaluation but also valuable to reinforcement corrosion and integrity survey. Contours must be created using measured parameter instead of converted ones.

Normally, contours provide well described pattern and anything that do not follow those patterns could be a region that should be paid attention to and concerned about. Figure-1 illustrates contours used to examine variable results of concrete in-situ tests.
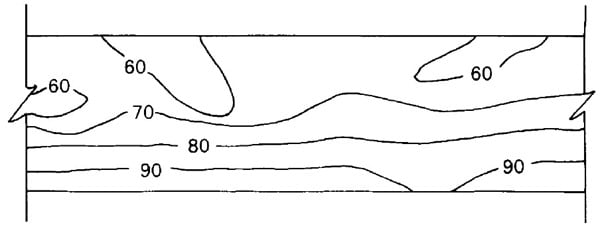
Relative Percentage Contours for a Beam

Fig.1: Typical Relative Percentage Contours for a Beam

Histogram is another graphical method employed to analyze concrete variability specifically in the case where great number of results are achieved. For example, testing large number of similar members or testing large members. Figure-2 and Figure-3 show typical histograms.

Well-Constructed Member using Uniform Concrete Supply

Fig.2: Well-Constructed Member using Uniform Concrete Supply

 Concrete In-Situ Test Results showing Poor Construction

Fig.3: Poor Construction

Numerical Methods of Concrete Test Results Examination

Coefficient of variation computation may give considerably important information about construction standard used. The coefficient of variation is equal to the standard deviation times 100 divided by mean.

Table-1 provides typical coefficient of variation values pertaining to the principal test methods that is likely to be anticipated for a single site made unit constructed from several batches.

Table-1: Typical coefficient of variation of test results and maximum accuracies of in-situ strength prediction for principal methods

Test method

Typical coefficient of variation for individual member of good quality construction , %

Best %95 confidence limits on strength estimates

Standard cores

10

Plus Minus Sign10% (3 specimens)

Small cores

15

Plus Minus Sign15% (9 specimens)

Pull-out

8

Plus Minus Sign20% (4 tests)

Internal fracture

16

Plus Minus Sign28% (6 tests)

Pull-off

8

Plus Minus Sign15% (6 tests)

Break-off

9

Plus Minus Sign20% (5 tests)

Windsor probe

4

Plus Minus Sign20% (3 tests)

Ultrasonic pulse velocity

2.5

Plus Minus Sign20% (1 test)

Rebound hammer

4

Plus Minus Sign25% (12 tests)

Calibration and/or Application of Concrete In-Situ Test Results

The calibration accuracy between measured test results and required properties of concrete is affected by number of factors which could be different for each specific test.

It is significant to focus on laboratory conditions for which calibration curves are created and in-situ test conditions specifically the difference in moisture and maturity conditions.

Concrete quality changes throughout the element and might not necessarily be the same in composition or laboratory condition. Severe weather condition, difficulties of access, and inexperienced operatives could create difficulties and consequently the tests may not be conducted suitably.

It is crucial that application of in-situ concrete test results takes these factors into consideration to determine their significance.

QUALITY OF AGGREGATE  FOR ASPHALT CONCRETE

AGGREGATES FOR ASPHALT CONCRETE

The amount of aggregates for asphalt concrete mixtures is generally 90 to 95 percent by weight and 75 to 85 percent by volume. Aggregates are primarily responsible for the load supporting capacity of a pavement. Aggregate has been defined as any inert mineral material used for mixing in graduated particles or fragments. It includes sand, gravel, crushed stone, slag, screenings, and mineral filler.

SOURCES OF AGGREGATES

Aggregates for asphalt concrete are generally classified according to their source or means of preparation. They include:

(1) Pit aggregates – Gravel and sand are natural aggregates and are typically pit material.

(2) Processed aggregates – Natural gravel or stone that have been crushed and screened are typical processed aggregates. In the crushing operation, stone dust is also produced.

(3) Synthetic or artificial aggregates – Aggregates resulting from the modification of materials, which may involve both physical and chemical changes are called synthetic or artificial aggregates. Blast furnace slag is the most commonly used artificial aggregate or lightweight aggregate.

EVALUATING QUALITY OF AGGREGATES

Selecting an aggregate material for use in an asphalt concrete depends upon the availability, cost, and quality of the material, as well as the type of construction that is intended.

The suitability of aggregates for use in asphalt concrete is determined by evaluating the material in terms of:

(1) SIZE AND GRADING

The maximum size of an aggregate designates the smallest sieve size through which 100 percent of the material will pass. Grading of an aggregate is determined by sieve analysis. Maximum size and grading are invariably controlled by specifications that prescribe the distribution of particle sizes to be used for a particular aggregate material for asphalt mixtures. The distribution of the particle sizes determines the stability and density of the asphalt mixture.

Also Read: Sieve Analysis Test of Aggregates

(2) CLEANLINESS

Some aggregates contain foreign or deleterious substances that make them undesirable for asphalt concrete mixtures. (Example: Clay lumps, shale, organic material, etc.). To find presence of deleterious materials in aggregate refer IS: 2386 – part-2.

The sand-equivalent test, described in AASHTO T 176, is a method of determining the relative proportion of detrimental fine dust or clay-like materials in the portion of aggregate passing the No. 4 (4.75 mm) sieve.

Also Read: Test for Clay Lumps and Friable Particles in Aggregates

Also Read: Determination of Light Weight Pieces in Aggregates

Also Read: Sand Equivalent Value Test of Fine Aggregates

(3) TOUGHNESS (HARDNESS)

Aggregates are subjected to additional crushing and abrasive wear during manufacture, placing, and compaction of asphalt concrete mixtures. Aggregates are also subjected to abrasion under traffic loads. They must exhibit an ability to resist crushing, degradation, and disintegration. The Los Angeles Abrasion test measures wear abrasion resistance of aggregates.

Also Read: Los Angeles Abrasion Test of Aggregates

Also Read: Crushing Value Test of Aggregates

Also read: Impact Value Test Procedure of Aggregates

(4) SOUNDNESS

Aggregates for asphalt concrete paving should be durable. They should not deteriorate or disintegrate under the action of weather. Items for consideration under weathering action are freezing, thawing, and variations in moisture content, and temperature changes. The soundness test is an indication of the resistance to weathering of fine and coarse aggregates. For test procedures see AASHTO T 104 or IS: 2386 part-V.

Also Read: Soundness Test Procedure of Aggregates

(5) PARTICLE SHAPE (FLAT & ELONGATED OR F/E)

Particle shape changes the workability of the mix as well as the compactive effort necessary to obtain the required density. Particle shape also has an effect on the strength of the asphalt concrete mix. Irregular or angular particles tend to interlock when compacted and resist displacement.

Also Read: Flakiness Index Value Test of Aggregates

Also Read: Elongation Index Value Test of Aggregates

(6) SURFACE TEXTURE (COARSE AGGREGATE ANGULARITY (CAA) AND FINE AGGREGATE ANGULARITY (FAA))

Like particle shape, the surface texture also influences the workability and strength of asphalt concrete mixtures. Surface texture has often been considered more important than shape of the aggregate particles. A rough, sandpaper-like surface texture as opposed to a smooth surface tends to increase the strength of the mix.

Also Read: Angularity Number Test of Aggregates

(7) ABSORPTION

The porosity of an aggregate is generally indicated by the amount of water it absorbs when soaked in water. A certain degree of porosity is desirable, as it permits aggregates to absorb binder, which then forms a mechanical linkage between the binder film and the stone particle.

Also read: Specific Gravity & Water Absorption Test Procedure of Aggregates

(8) AFFINITY FOR BINDER

Stripping (separation) of the binder film from the aggregate through the action of water may make an aggregate material unsuitable for asphalt concrete mixtures. Such material is referred to as hydrophilic (water loving). Many of these materials may be used with the addition of a heat stable additive that reduces the stripping action. Aggregates which exhibit a high degree of resistance to stripping in the presence of water are usually most suitable in asphalt concrete mixes. Such aggregates are referred to as hydrophobic (water hating). Why hydrophobic or hydrophilic aggregates behave as they do is not completely understood. The explanation is not so as important as the ability to detect the properties and avoid the use of aggregates conducive to stripping.

The strength loss resulting from damage caused by “stripping” under laboratory controlled accelerated water conditioning is determined in accordance with AASHTO T 283 or as per IS: 6241-1971.

BEARING CAPACITY FROM STANDARD PENETRATION TEST

STEP-BY-STEP PROCEDURE FOR CALCULATION OF BEARING CAPACITY FROM STANDARD PENETRATION TEST VALUES OR N-VALUES

STEP-1

Perform standard penetration test on the location for which you want to calculate bearing capacity. This is done as per standard procedure given in IS-2131. Standard penetration test must be done at every 75 cm in vertical direction.

STEP-2

Decide the depth, width and length of foundation for initial calculation. This is a trial and error process. In the first attempt, you can never get the exact size of foundation which will satisfy all of your needs.

STEP-3

Apply necessary corrections to the standard penetration test values. Calculate the cumulative average value of corrected SPT values from the base level of foundation to a depth equal to 2 times the width of foundation.

STEP-4

Correlate the above cumulative average SPT value with the fig given below to find out the corresponding angle of shearing resistance (ϕ).

Relation between phi and SPT value (N)

STEP-5

Calculate effective surcharge at the base level of foundation by multiplying the effective unit weight of soil with the depth of the foundation i.e.

q = ϒ*Df

Where,

q = Effective surcharge at the base level of foundation, in kgf/cm2

ϒ = Unit weight of soil, in kgf/cm3

Df = Depth of foundation, in cm

STEP-6

For the angle of shearing resistance value (ϕ) as calculated in step-4, find out the corresponding values of bearing capacity factors (i.e. Nq & Nϒ) from the table given below. For the intermediate values of ‘ϕ’, make linear interpolation.

Bearing Capacity Factors

STEP-7

Calculate shape factors (i.e. sq & sϒ) using formula given below.

Shape Factors

Where,

B = Width of foundation, in cm

L = Length of foundation, in cm

STEP-8

Calculate depth factors (i.e. dq & dϒ) using following formula.

dq=dϒ=1 (for ϕ < 100)

dq = dϒ = 1+0.1(Df/B)(Nϕ)1/2 (for ϕ>100)

Nϕ is calculated using following formula

Nϕ = tan2[(π/4)+(ϕ/2)]

STEP-9

Calculate inclination factors (i.e. iq & iϒ) using the formula given below

Inclination factor

Where,

α = Inclination of the load to the vertical in degrees

ϕ = Angles of shearing resistance in degrees

STEP-10

Calculate the correction factor for location of water table using the following formula

W’ = 0.5+0.5[Dw/(Df+B)]

Where,

W’ = Correction factor for location of water table

Dw = Depth of water table, in cm

Df = Depth of foundation, in cm

STEP-11

Using the equation given below calculate the net ultimate bearing capacity.

Bearing capacity equation1

Where,

qd = Net ultimate bearing capacity of foundation, kgf/cm2

q = Effective surcharge at base level of foundation, in kgf/cm2 (Refer step-5)

Nq & Nϒ = Bearing capacity factors (Refer step-6)

sq & sϒ = Shape factors (Refer step-7)

dq & dϒ = Depth factors (Refer step-8)

iq & iϒ = Inclination factors (Refer step-9)

W’ = Correction factor for location of water table (Refer step-10)

B = Width of foundation, in cm

ϒ = Bulk unit weight of foundation soil, in kgf/cm3.

CORRECTION TO STANDARD PENETRATION VALUE

The N-value observed during testing is not utilized directly in assessing soil properties. These values are corrected to account for

  1. The overburden pressure
  2. Dilatancy in saturated fine sands and silts

CORRECTION FOR OVERBURDEN PRESSURE

The penetration resistance of soil depends on the over burden pressure. At deeper depth in-situ soil will have higher overburden pressure hence its response to SPT test will be better when compared to the behavior of the same soil at shallow depth.

Bazaraa (1967 Bowels, p99) proposed the following corrections to the actual count N, based on the over burden pressure

For p<= 75 kPa

SPT 1

For p0 > 75 kPa

SPT 2

Where

N’ = corrected N value

N = observed N-value

P0 = over burden pressure, (kPa) = γ x D

D = depth of testing (m)

γ = unit weight of soil at the time of testing

  • N’ is increased from the actual blow count when p0 <=75 kPa
  • N’ is decreased from the actual blow count when p0 >75 kPa

CORRECTION FOR THE DILATANCY IN SATURATED FINE SANDS AND SILTS

When dynamic loads are applied on silty and fine sandy soils in saturated state the pore pressure in such soil will not be in a position to get dissipated due to low permeability. Hence, during dynamic loading (i.e. application of  blows) the pore water will offer a temporary resistance to dynamic loads. This leads to higher value of N-value which is unsafe. Therefore when SPT is performed in saturated silts and fine sands and if the observed N-value is more than 15, a correction has to be applied to reduce the observed values. This correction is applied on the N-value corrected for over burden pressure (N’).

If the stratum (during testing) consists of fine sand & silt below water table, the corrected N-value (N’) has to be further corrected to get the final corrected value N”.

SPT 3

STANDARD PENETRATION TEST

STANDARD PENETRATION TEST (SPT) PROCEDURE

AIM

To perform standard penetration to obtain the penetration resistance (N-value) along the depth at a given site.

EQUIPMENT & APPARATUS

  • Tripod (to give a clear height of about 4 m; one of the legs of the tripod should have ladder to facilitate a person to reach tripod head.)
  • Tripod head with hook
  • Pulley
  • Guide pipe assembly
  • Standard split spoon sampler
  • A drill rod for extending the test to deeper depths
  • Heavy duty post hole auger (100 mm to 150 mm diameter)
  • Heavy duty helical auger
  • Heavy duty auger extension rods
  • Sand bailer
  • Rope (about 15 m long & strong enough to lift 63.5 kg load repeatedly)
  • A light duty rope to operate sand bailer
  • Chain pulley block
  • Casing pipes
  • Casing couplings
  • Casing clamps
  • Measuring tapes
  • A straight edge (50 cm)
  • Tool box
Standard Penetration Test Setup

PROCEDURE

  1. Identify the location of testing in the field
  2. Erect the tripod such that the top of the tripod head is centrally located over the testing spot. This can be reasonably ensured by passing a rope over the pulley connected to the tripod head and making the free end of the rope to come down and adjusting the tripod legs such that the rope end is at the testing spot. While erecting and adjusting the tripod legs, care should be taken to see that the load is uniformly distributed over the three legs. This can be achieved by ensuring the lines joining the tips of the tripod legs on the ground forms an equilateral triangle. Further, it should be ensured that the three legs of the tripod are firmly supported on the ground (i.e. the soil below the legs should not be loose and they should not be supported on a sloping rock surface or on a small boulder which may tilt during testing.)
  3. Advance the bore hole, at the test location, using the auger. To start with advance the bore hole for a depth of 0.5 m and clear the loose soil from the bore hole.
  4. Clean the split spoon sampler and apply a thin film of oil to the inside face of the sampler. Connect an A-drill extension rod to the split spoon sampler.
  5. Slip the 63.6 kg weight on to the guide pipe assembly and connect the guide pipe assembly to the other end of the A-drill rod.
  6. The chain connected to the driving weight is tied to the rope passing over the pulley at the tripod head. The other end of the rope is pulled down manually or with help of mechanical winch. By pulling the rope down, the drive weight, guide pipe assembly, A-drill rod and the split spoon sampler will get vertically erected.
  7. A person should hold the guide pipe assembly split spoon sampler to be vertical with the falling weight lowered to the bottom of the guide assembly.
  8. Now place a straight edge across the bore touching the A-drill rod. Mark the straight edge level all round the A-drill rod with the help of a chalk or any other marker. From this mark, measure up along the A-drill rod and mark 15 cm, 30 cm and 45 cm above the straight edge level. Lift the driving weight to reach the top of the guide pipe assembly travel and allow it to fall freely. The fall of driving weight will transfer the impact load to the split spoon sampler, which drive the split spoon sampler into the ground. Again lift the drive weight to the top of travel and allow it to fall freely under its own weight from a height of 75 cm. as the number of blows are applied, the split spoon sampler will penetrate into the ground and the first mark (15 cm mark) on the drill rod approaches the straight edge.
  9. Count the number of blows required for the first 15 cm, second 15 cm and the third 15 cm mark to cross down the straight edge.
  10. The penetration of the first 15 cm is considered as the seating drive and the number of blows required for this penetration is noted but not accounted in computing penetration resistance value. The total number of blows required for the penetration of the split spoon sampler by 2nd and 3rd 15 cm is recorded as the penetration resistance or N-value.
  11. After the completion of the split spoon sampler by 45 cm, pull out the whole assembly. Detach the split sampler from A-drill rod and open it out. Collect the soil sample from the split spoon sampler into a sampling bag. Store the sampling bag safely with an identification tag for laboratory investigation.
  12. Advance the bore hole by another 1 m or till a change of soil strata which ever is early.
  13. The test is repeated with advancement of bore hole till the required depth of exploration is reached or till a refusal condition is encountered. Refusal condition is said to exist if the number of blows required for the last 30 cm of penetration is more than 100.
  14. The test will be repeated in number of bore holes covering the site depending on the building area, importance of the structure and the variation of the soil properties across the site.
  15. The SPT values are presented either in the form of a table or in the form of bore log data.

INITIAL AND FINAL SETTING TIME

Initial setting time is that time period between the time water is added to cement and time at which 1 mm square section needle fails to penetrate the cement paste, placed in the Vicat’s mould 5 mm to 7 mm from the bottom of the mould.

Final setting time is that time period between the time water is added to cement and the time at which 1 mm needle makes an impression on the paste in the mould but 5 mm attachment does not make any impression.

INITIAL AND FINAL SETTING TIME
We need to calculate the initial and final setting time as per IS: 4031 (Part 5) – 1988. To do so we need Vicat apparatus conforming to IS: 5513 – 1976, Balance, whose permissible variation at a load of 1000g should be +1.0g, Gauging trowel conforming to IS: 10086 – 1982.

Procedure to determine initial and final setting time of cement
i) Prepare a cement paste by gauging the cement with 0.85 times the water required to give a paste of standard consistency.
ii) Start a stop-watch, the moment water is added to the cement.
iii) Fill the Vicat mould completely with the cement paste gauged as above, the mould resting on a non-porous plate and smooth off the surface of the paste making it level with the top of the mould. The cement block thus prepared in the mould is the test block.

A) INITIAL SETTING TIME
Place the test block under the rod bearing the needle. Lower the needle gently in order to make contact with the surface of the cement paste and release quickly, allowing it to penetrate the test block. Repeat the procedure till the needle fails to pierce the test block to a point 5.0 ± 0.5mm measured from the bottom of the mould.The time period elapsing between the time, water is added to the cement and the time, the needle fails to pierce the test block by 5.0 ± 0.5mm measured from the bottom of the mould, is the initial setting time.

B) FINAL SETTING TIME
Replace the above needle by the one with an annular attachment. The cement should be considered as finally set when, upon applying the needle gently to the surface of the test block, the needle makes an impression therein, while the attachment fails to do so. The period elapsing between the time, water is added to the cement and the time, the needle makes an impression on the surface of the test block, while the attachment fails to do so, is the final setting time.