Category Archives: ENVIRONMENTAL ENGINEERING

NOISE POLLUTION NORMALS

Noise Pollution Norms

INTRODUCTION

Noise is defined as unwanted sound.Sound which pleases the listeners is musicand that which causes pain and annoyance is noise.At times what is music for some can be noise for others.

Most of the machines that have been developed for industrial purposes,for high speed transportation,or to make life more enjoyable,by furnishing additional comfort,reducing the drudgery of everyday living,and speeding up our daily routines to provide additional leisure hours,are accompanied by noise. Noise prevention and control is important as noise affects us in hearing,abilityto communicate and behaviour.Undoubtedly,lesser noise can make the environment more friendly and life becomes pleasant.

SOURCES OF NOISE

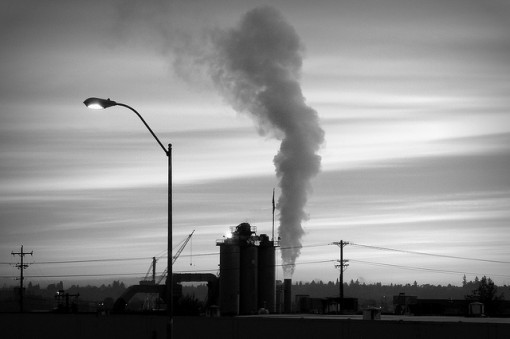
Various sources of noise are : industry,road traffic,rail traffic,air traffic,construction and public works,indoor sources(air conditioners,air coolers,radio,television and other home appliances)etc.In Indian conditions, indiscriminate use of public address system and DG sets,has given a new dimension to the noise pollution problem.

STANDARDS AND GUIDELINES

  • The Central Pollution Control Board constituted a Committee on Noise Pollution Control.The Committee recommended noise srandards for ambient air and for automobiles,domestic appliances and construction equipments,which were laternotified in Environment(Protection) Rules,1986 as given below:-
    -------------------------------------------------------------------------------      Area                Category of Area              Limits in dB(A),Leq
         Code                                            Day time      Night time
    -------------------------------------------------------------------------------
          A                  Industrial area                75             70    
          B                  Commercial area                65             55
          C                  Residential area               55             45
          D                  Silence Zone                   50             40
    -------------------------------------------------------------------------------
    

    Note: 1.Day time is reckoned in between 6 a.m. and 9 p.m.
    2.Night time is reckoned in between 9 p.m. and 6 a.m.
    3.Silence zone is referred as areas upto 100 meters around such premises as hospitals,educational institutions and courts.The Silence zones are to be declared by the Competent Authority.
    Use of vehicular horns,loudspeakers and bursting of crackers shall be banned in these zones.
    4.Mixed categories of areas should be declared as one of the four above mentioned categories by the Competent Authority and the corresponding standards shall apply.

  • Noise standards for automobiles,domestic appliances and construction equipments have been notified in Part ‘E’,Schedule-VI of Environment(Protection)Rules,1986,as ammended on 19th May,1993,as given in the Tables below.
-------------------------------------------------------------------------------
    Category of Vehicle                                   Noise limit in dB(A)
-------------------------------------------------------------------------------
(a)Motorcycle,scooters and three                                  80
wheelers.
(b)Passenger Cars                                                 82
(c)Passenger or commercial vehicles                               85
upto 4 MT
(d)Passenger or commercial vehicles                               89
above 4 MT and upto 12 MT
(e)Passenger or commercial vehicles                               91
exceeding 12 MT
------------------------------------------------------------------------------


------------------------------------------------------------------------------
Category of Domestic Appliances/                        Noise limits in dB(A)
Construction Equipments
------------------------------------------------------------------------------
(a)Window air conditioners of 1 tonne                            68
to 1.5 tonne    
(b)Air Coolers                                                   60
(c)Refrigerators                                                 46
(d)Diesel Generator for domestic purposes                      85 - 90
(e)Compactors(rollers),Front loaders,                            75
Concrete mixers,Cranes(movable),
Vibrators and Saws
------------------------------------------------------------------------------

The Noise Pollution Control Committee also prescribed code of practice for controlling noise from sources other than industries and automobiles,as given below:

Code of practice for Controlling Noise from Sources other than Industries and Automobiles

Public Address System

  • License must be obtained by all parties intending to use loudspeakers or public address system for any occasion.
  • Public address system and loudspeakers should not be used at night between 9 p.m. to 6 a.m. except in closed premises.
  • Loudspeakers should be directed at the audiences and not away from audience (i.e.not towards the neighbourhood).
  • Loudspeakers should not be allowed for advertisement and commercial activities.
  • The permitted strength of power amplifier should be just adequate to cover the audience,and noise level beyond the boundary limit of the noise source premises should not be increased by more than 5 dB(A) above the ambient noise level.
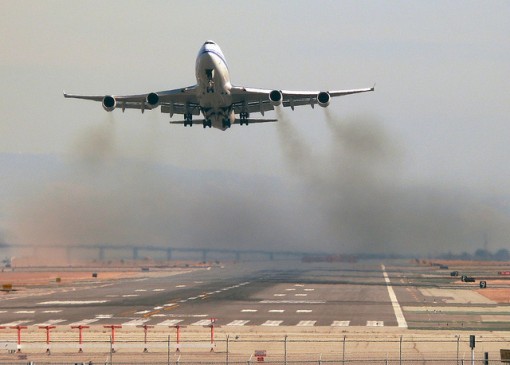
Aircraft Operations

  • Aerodrome should be located away from the city and growth of the city shouldnot be allowed to extend upto the Aerodrome.
  • Aeroplanes should take off in direction radially away from the city.
  • During boarding and unboarding operations the plane should be sufficiently away from the airport buildings.
  • Night-time operations should be minimised.
  • During maintenance and repairs of the aeroplane,workers should use ear muffs.
  • Portable silencers should be used in the plane intake as well as exhaust during idling period at the airport.

Railway Operations

  • Erection of acoustic barrier,reducing speed and avoiding whistling within and along the municipal limits and habitation zones are recommended for adoptionto the extent possible.

Construction Activities

  • Acoustic barriers should be placed near construction sites.
  • The maximum noise levels near the construction site should be limited to 75 dB(A) Leq(5 min.) in industrial areas and to 65 dB(A) Leq(5 min.) in other areas.
  • There shoulld be fencing around the construction site to prevent people coming near the site.
  • Materials need not be stockpiled and unused equipment to be placed between noisy operating equipments and other areas.
  • Constructing temporary earth bund around the site using soil etc,which normally is hauled away from the construction site.

Burning of Crackers

  • Manufacture and sale of crackers having an impulsive noise having an impulsive noise of more than 90 dB at 5 meters distance from the site of bursting should be banned.
  • Manufacture and bursting of joined crackers should be banned.
  • Bursting of crackers during night between 9 p.m. and 6 a.m. should be banned.
  • Bursting of crackers may be permitted only during public festivals.

The permissible levels for noise exposure for work zone area have been prescribed under the Model Rules of the Factories Act,1948,as given in the Tables below.

-------------------------------------------------------------------------------
Peak sound pressure                               Permitted number of 
level in dB                                       impulses or impact/day
------------------------------------------------------------------------------- 
        140                                               100
        135                                               315
        130                                              1000
        125                                              3160
        120                                             10000
-------------------------------------------------------------------------------

Notes:
1.No exposure in excess of 140 dB peak sound pressure level is permitted.
2.For any peak sound pressure level falling in between any figure and the
next higher or lower figure as indicated in column 1,the permitted number of
impulses or impacts per day is to be determined by extrapolation on a 
proportionate basis.


------------------------------------------------------------------------------
    Total time of exposure                           Sound pressure level 
    (continuous or a number                                in dB(A)
    of short term exposures)
    per day,in hr
------------------------------------------------------------------------------
             8                                                90
             6                                                92
             4                                                95
             3                                                97
             2                                               100
             1-1/2                                           102
             1                                               105
             1/2                                             107
             1/4                                             110
             1/8                                             115
------------------------------------------------------------------------------

Notes:
1.No exposure in excess of 115 dB(A) is to be permitted.
2.For any period of exposure falling in between any figure and the next 
higher or lower figure as indicated in column 1,the perrmissible sound presssurelevel is to be determined by extrapolation on a proportionate basis.


NOISE IMPACTS

What is noise? The best definition I found in my travels around the internet is that noise isunwanted sound . Some sites talk about noise simply in terms of decibel levels, but noise is more than that. It includes things like duration of the noise, frequency, time of day, personal preferences, and whether you have control of that sound or not. 


Many groups and organizations have done exhaustive studies on noise. The Environmental Protection Agency (EPA) of the United States recognized noise as a problem back in the 1970’s. They undertook a major study of noise at that time and have continued to update their findings. 

The World Health Organization (WHO) has studied noise extensively and has published the most comprehensive information I could find on the internet. And many other medical and environmental groups have done the same. 

One of the best internet sites, with links to most noise web sites, is the Noise Pollution Clearinghouse (NPC). If you want to really research the topic of noise, the NPC site is the place to start. 

The above sites can all be accessed through our links page. 

The conclusion drawn by these groups is that noise hurts. It hurts our health, our hearing and our enjoyment of life. The following are more specifics about the impacts of noise.

 Noise Impacts:

  • the most obvious impact of noise is to our hearing. The British Columbia Workers’ Compensation Board (WCB) have set 85 decibels as their maximum exposure limit in the workplace. Above this level, hearing protection should be worn. They state that the threshold of pain is reached at 120 decibels, and they class 140 decibels as extreme danger. WHO values are similar while the EPA tend to have even stricter standards of 70 decibels as a maximum safe noise level in the work place. Relating this to propane cannons and AV Alarms, these devices create noise at between 115 and 130 decibels. Think of the impacts to neighbors who live close by, and berry pickers working the fields. The safe level away from the workplace, ie. around home is 50 – 55 decibels. 
  • The other end of the spectrum is acceptable noise levels at home and in non work environments. Studies have found that steady noise above 50 decibels becomes a moderate annoyance and above 55 a serious annoyance at home. For health and safety reasons in a non work environment, 55 decibels is set as a safe level for outside and 45 decibels inside. Hospitals and schools safe levels are 35 decibels. So how much harm is being done and what are the annoyance levels for someone living beside a propane cannon blasting away at 120 decibels? The new and improved Ministry of Agriculture regulations created in January, 2002 state that propane cannons can be no closer than 150 meters from a neighboring residence, and 100 meters for other types of noisemakers. These devices produce noise at levels between 115 and 130 decibels. At 100 meters the noise produced is over 80 decibels, and over 75 decibels at 150 meters, which is much higher than specified safe levels for around the home. In fact, over 80 decibels is close to the level at which ear protection should be worn. 
  • noise above safe levels leads to a number of known health impacts: 
    • annoyance
    • stress 
    • high blood pressure 
    • sleep loss 
    • the inability to concentrate 
    • the inability to learn 
    • loss of productivity, etc. The World Health Organization goes into these extensively.
  • Another area of concern is impacts on children and on learning. Documents state that the exposure levels set for adults should be lower for children. The concerns are that hearing could be impaired at a young age and never fully develop. Also, noise affects concentration and behavior in youngsters, and thus their ability to learn. This applies to children at school as well as children at home trying to study. And don’t forget, the propane cannon season stretches well into October in British Columbia, well into the school year. The following are two articles that warn of the impacts of noise on children and how noise hampers a child’s ability to learn. Have you heard? Noise can affect learning! 

    Children and noise 

    There is also an article on the NPC site about the negative impact of noise on pregnant women and their fetuses titled: ” Noise: A Hazard for the Fetus and Newborn”. 

  • Another area that our Ministry of Agriculture people never mention, as they defend the berry farmers right to blast away with noisemakers, is the impact on other livestock and poultry. If cannons frighten the daylights out of wild birds, what do they do to the chickens in the barn next door. What are the impacts on egg production and growth rates of brood chickens raised for food? 
    And how about other forms of livestock such as sheep, cattle and horses. It is well known that most animals have more acute hearing than people, so why aren’t our agriculture departments concerned about this? The Ministry’s own livestock publications state that, “the noise made by cannons often generates complaints from surrounding neighbours and on livestock farms will be disturbing to both the livestock and the starlings”. (Ref. Starlings and Livestock Farms, Order No. 384.200-7, of March 2000).
    Why do you think so many non-berry farmers belong to our group, Ban the Cannons! 
  • Another impact is property values. We bought our property about ten years ago, in February. I guess the joke’s on us! We could probably sell the place again in February, but good luck selling in August. Maybe people should start asking municipal governments for tax adjustments because cannons have lessened the value of their property. Just ask our summertime guests as they leave, mostly early, what they think about cannons. A common question we get asked is, “How can you put up with that noise?” 
  • And a final impact is a person’s right to peace, tranquility, and enjoyment of property. The Canadian Charter of Rights states that peace, quiet and enjoyment of property are a basic human right. All municipal bylaws in the lower mainland of British Columbia said the same thing until the Farm Practices Act came along and wiped out this basic human right. 


And finally some quotes from the Noise Pollution Clearinghouse are a good way to end this page: 

  • Noise is unwanted sound. It is derived from the Latin word “nausea,” meaning seasickness. 
  • The immediate cause of noise pollution is a failure of individuals and businesses to recognize that the air around us is “common property” shared by everyone. No one has a right to fill it with noise any more than they have the right to fill it with noxious fumes. Although they often don’t realize it, noisy neighbors are in fact bullies, claiming rights and freedoms that are not theirs, while degrading a precious resource, peace and quiet, that belongs to everyone. 
  • Noise that is experienced by people who did not produce it is “second-hand sound,” and is among the most pervasive pollutants today. Like second-hand smoke, it has detrimental effects on people who had no part in creating it. 
  • Your right to make noise ends where your neighbor’s right to peace and quiet begins.

Propane Cannons are a pain in the ear!

INTRODUCTION OF SOLID WASTE MANAGEMENT

Introduction

Solid waste management can be thought of as a chain of linked stages, as shown in Figure 9.1. The chain begins with the generation of waste by individual households, institutions and workplaces. This is Stage 1, which you learned about in Study Session 7. Stage 2, covered in Study Session 8, is where the ‘3 Rs’ should be practised by separating the waste at source. This study session focuses on Stage 3. Waste treatment and disposal, the final stage, is covered in Study Session 10.

Figure 9.1  Four stages of the waste management chain.

In this study session you will be guided through the principles and strategies for storing, collecting, transferring and transporting solid waste.

Learning Outcomes for Study Session 9

When you have studied this session, you should be able to:

9.1  Define and use correctly each of the terms printed in bold. (SAQ 9.1)

9.2  Explain the difference between primary and secondary waste collection arrangements. (SAQ 9.1)

9.3  Explain the need for solid waste transfer stations. (SAQ 9.2)

9.4  List possible solid waste collection equipment needed for small- and medium-sized towns. (SAQ 9.3)

9.5  Identify ways of involving private collectors to increase the efficiency of solid waste collection. (SAQ 9.4)

9.1  Background

Solid waste is a major problem for cities in developing countries. It is considered to be a big challenge because it needs commitment, time and effort from businesses and householders to practise reduction, reuse and recycling. It also requires major financial investment as well as infrastructure development. A well-planned collection and transfer process can lead to significant reductions in the overall cost of waste management.

The national Solid Waste Management Proclamation sets out the regulations for waste management in Ethiopia. Its overall aim is to ‘… prevent the possible adverse impacts while creating economically and socially beneficial assets out of solid waste.’ (FDRE, 2007).

Among its clauses, the Proclamation makes urban administrations responsible for producing and implementing solid waste management plans. At the practical level, administrations are required to install waste bins in streets and public places, and to collect waste from these bins often enough to prevent them overflowing.

Ethiopia has a long way to go to achieve adequate waste collection systems in all its towns and cities. For example, in Addis Ababa, only 65% of the city’s solid waste was collected in 2003 (Regassa et al., 2011). More recent data indicates that this figure has since increased to 80% (Tessema, 2010; PPIAF, 2011). Even so, the city still has considerable progress to make. In other towns, the situation is worse. In Dessie, 48% of residents practise ‘open dumping’ of their waste (Sharma et al., 2012). In other words they deposit it on the roadside, on abandoned land, in open sewers or river banks, or around their yard. In Bahir Dar the collection rate was estimated in 2010 to be 67% and in Mekelle, until recently, only a third of total waste generated was collected by the municipality (Tefera and Negussie, 2015).

  • You read about some of the negative effects of poor solid waste management in Study Session 2. Make a list of the benefits to everyone of having a good waste collection system.

  • Your list will probably include the following. A good waste collection system can:

    • reduce the number of flies, rodents and other scavenging animals that can spread diseases
    • keep drains clear avoiding flooding and contamination of watercourses
    • make the area more pleasant
    • encourage people to look after their area
    • encourage businesses to stay in the area or others to move there
    • help to build a healthier society where people can earn more money and children can gain more from their schooling.

In Ethiopia and many other developing countries, collection is the most expensive stage of the waste management process chain – one estimate suggests that it demands 50–70% of the total budget (Tchobanogous and Kreith, 2002). So it is important that an effective collection system is in place.

9.2  Waste storage containers

The third stage of the waste management chain (Figure 9.1) begins when a householder or business employee puts their waste in a container. The choice of container will depend on several factors, including the wealth of the household and the amount of waste to be collected. It will also depend on the collection system – is it collected from outside the house or does the householder have to empty it into a communal container?

The simplest and cheapest storage containers for individual households are old lidded food containers, similar to Figure 9.2(a). You saw some other examples of simple domestic waste containers in Figure 7.4 in Study Session 7. It is easy for a householder to empty these containers into a communal bin for collection. At the other extreme are wheeled bins that can hold up to 240 litres of waste (Figure 9.2(c)). These need to be emptied into a vehicle fitted with lifting equipment. Any system using this type of bin needs well-maintained wide roads within 10 m or so of each property served.

Figure 9.2  Household waste storage containers: (a) old ten-litre food container; (b) 60-litre metal bin; (c) 240-litre wheeled bin. (Cowing et al., 2014)

Communal bins need to be larger than domestic containers and they should also be more robust. Often they need to be emptied by a specialised vehicle fitted with lifting equipment (described in the next section). Some examples are shown in Figure 9.3.

Figure 9.3  Communal waste containers: (a) Metal bin with 1 m3 capacity; (b) Waste skip – these can range from 3 to 15 m3. (Cowing et al., 2014)

Effective waste management in needs commitment from both the local people and the kebele authorities. The people should use the communal waste containers in the correct way and avoid littering. In return, the kebele or town administration (or its contractors) should empty the containers at regular, predetermined times (for example, every Tuesday and Thursday morning) and keep the containers and immediate area clean.

9.3  Primary and secondary collection

After on-site storage, the next step is collection.Primary collection is the collection of waste from the point where it is placed by the person or organisation that has produced it. These collection points could be located outside each individual household and business, communal containers serving a number of households, or waste skips taking waste from households and businesses in the surrounding area. Depending on the collection vehicle and the distance to the waste treatment/disposal site, the waste at this stage may be taken to the final disposal site or to a transfer station, as described in Section 9.4.

Primary collection can be done in many ways. Table 9.1 summarises the lower-technology options that are suitable for collecting waste from households and transporting it to a transfer station or local disposal site. These all have the benefit of being able to serve narrow streets in crowded areas.

Secondary collections are where the waste from a number of primary collections is taken from the transfer station to the final disposal site. Table 9.2 shows some options for secondary waste collection vehicles, but note that some of these are also used for primary collections in certain situations.

AIR QUALITY STANDARDS

Air quality standards

View real-time air quality up-to-date information for air monitoring locations.

The Environmental Protection Agency manages the ambient air quality monitoring network.


In order to protect our health, vegetation and ecosystems, EU directives set down air quality standards in Ireland and the other member states for a wide variety of pollutants. These rules include how we should monitor, assess and manage ambient air quality.

The European Commission set down the principles to this approach in 1996 with its Air Quality Framework Directive. Four “daughter” directives lay down limits for specific pollutants:

  • 1st Daughter Directive: Sulphur dioxide, nitrogen dioxide and oxides of nitrogen, particulate matter and lead
  • 2nd Daughter Directive: Carbon monoxide and benzene
  • 3rd Daughter Directive: Ozone
  • 4th Daughter Directive: Polyaromatic hydrocarbons, arsenic, nickel, cadmium and mercury in ambient air

The Ambient Air Quality and Cleaner Air for Europe (CAFE) Directive (2008/50/EC) was published in May 2008.  It replaced the Framework Directive and the first, second and third Daughter Directives.  The fourth Daughter Directive(2004/107/EC) will be included in CAFE at a later stage. The limit and target values for both Directives are outlined below.

The CAFE Directive was transposed into Irish legislation by the Air Quality Standards Regulations 2011 (S.I. No. 180 of 2011). It replaces the Air Quality Standards Regulations 2002 (S.I. No. 271 of 2002), the Ozone in Ambient Air Regulations 2004 (S.I. No. 53 of 2004) and S.I. No. 33 of 1999.

The fourth Daughter Directive was transponsed into Irish legislation by the Arsenic, Cadmium, Mercury, Nickel and Polycyclic Aromatic Hydrocarbons in Ambient Air Regulations 2009(S.I. No. 58 of 2009).

Links to EU and Irish ambient air quality legislation currently in force

Directives set targets for air quality

The following tables show the limit or target values specified by the five published directives that set down limits for specific air pollutants. The directives cover:

  • Sulphur dioxide, nitrogen dioxide and oxides of nitrogen, particulate matter (PM10 and PM2.5) and lead
  • Carbon monoxide and benzene
  • Ozone
  • Arsenic, Cadmium, Nickel and Benzo(a)pyrene

Check the bottom of this article for explanations of the abbreviations used.

Limit values of CAFE Directive 2008/50/EC

Pollutant Limit Value Objective Averaging Period Limit Value
ug/m3
Limit Value 
ppb
Basis of Application of the Limit Value Limit Value Attainment Date
SO2 Protection of human health 1 hour 350 132 Not to be exceeded more than 24 times in a calendar year 1 Jan 2005
SO2 Protection of human health 24 hours 125 47 Not to be exceeded more than 3 times in a calendar year 1 Jan 2005
SO2 Protection of vegetation calendar year 20 7.5 Annual mean 19 July 2001
SO2 Protection of vegetation 1 Oct to 31 Mar 20 7.5 Winter mean 19 July 2001
NO2 Protection of human health 1 hour 200 105 Not to be exceeded more than 18 times in a calendar year 1 Jan 2010
NO2 Protection of human health calendar year 40 21 Annual mean 1 Jan 2010
NO + NO 2 Protection of ecosystems calendar year 30 16 Annual mean 19 July 2001
PM10  Protection of human health 24 hours 50   Not to be exceeded more than 35 times in a calendar year 1 Jan 2005
PM10  Protection of human health calendar year 40   Annual mean 1 Jan 2005

PM2.5 –

Stage 1

Protection of human health calendar year 25   Annual mean 1 Jan 2015

PM2.5 –

Stage 2 

Protection of human health calendar year 20   Annual mean 1 Jan 2020
Lead Protection of human health calendar year 0.5   Annual mean 1 Jan 2005
 Carbon Monoxide Protection of human health 8 hours 10,000  8620 Not to be exceeded 1 Jan 2005
Benzene  Protection of human health  calendar year 5 1.5  Annual mean  1 Jan 2010

Alert thresholds

The public must be informed if the following thresholds are exceeded for three consecutive hours.

Pollutant Averaging Period Limit Value
Sulphur Dioxide 1 hour 500 ug/m3
Nitrogen Dioxide 1 hour 400 ug/m3


Target values and long-term objectives of CAFE Directive 2008/50/EC

Target values for ozone from 2010

Objective Parameter Value
Protection of human health Maximum daily 8 hour mean 120 ug/m3 not to be exceeded more than 25 days per calendar year averaged over 3 years
Protection of vegetation AOT40, calculated from 1 hour values from May to July 18000 ug/m3-h averaged over 5 years

Long-term objectives for ozone from 2020

Objective Parameter Value
Protection of human health Maximum daily 8 hour mean 120 ug/m3
Protection of vegetation AOT40, calculated from 1 hour values from May to July 6000 ug/m3-h

The public must be informed if ozone levels exceed the following thresholds

  Parameter Threshold
Information Threshold 1 hour average 180 ug/m3
Alert Threshold 1 hour average 240 ug/m3

 Target Values of Directive 2004/107/EC

 Pollutant Limit Value Objective   Averaging Period

Target Value ng/m3 

 Limit Value Attainment Date
 Arsenic  Protection of human health  calendar year  6  31 Dec 2012
 Cadmium  Protection of human health  calendar year  5  31 Dec 2012
 Nickel  Protection of human health   calendar year  20  31 Dec 2012
Benzo(a)pyrene  Protection of human health  calendar year 1  31 Dec 2012


Nitrogen dioxide 1 ppb = 1.91 ug/m3 
Sulphur dioxide 1 ppb = 2.66 ug/m3 
Ozone 1 ppb = 2.0 ug/m3 
Carbon monoxide 1 ppb = 1.16 ug/m3 
Benzene 1 ppb = 3.24 ug/m3

An example of calculating the AOT40 

The following is a worked example:

Local Time Ireland Central European Time Ozone Concentration ug/m3 Difference between previous column and 80 ug/m3
23:00 00:00 63 Not counted before 08:00
00:00 01:00 70 Not counted before 08:00
01:00 02:00 65 Not counted before 08:00
02:00 03:00 63 Not counted before 08:00
03:00 04:00 45 Not counted before 08:00
04:00 05:00 54 Not counted before 08:00
05:00 06:00 56 Not counted before 08:00
06:00 07:00 55 Not counted before 08:00
07:00 08:00 55 Only values greater than 80 count
08:00 09:00 62 0
09:00 10:00 51 0
10:00 11:00 70 0
11:00 12:00 92 12
12:00 13:00 90 10
13:00 14:00 82 2
14:00 15:00 87 7
15:00 16:00 91 11
16:00 17:00 90 10
17:00 18:00 89 9
18:00 19:00 84 4
19:00 20:00 85 Not counted after 20:00
20:00 21:00 83 Not counted after 20:00
21:00 22:00 70 Not counted after 20:00
22:00 23:00 60 Not counted after 20:00
AOT40 = sum of values in the 4th column = 65 ug/m3 hours

Abbreviations used

  • ug/m3 – micrograms per cubic metre
  • ng/m3 – nanograms per cubic metre
  • ppb – parts per billion
  • NO2 – Nitrogen Dioxide
  • NO – Nitric Oxide
  • SO2 – Sulphur Dioxide
  • PM10 – Particulate Matter with a diameter less than 10 microns
  • PM2.5– Particulate Matter with a diameter less than 2.5 microns
  • AOT40 – This is a measure of the overall exposure of plants to ozone. It is the sum of the excess hourly concentrations greater than 80 ug/m3 and is expressed as ug/m3 hours. Only values measured between 08:00 and 20:00 Central European Time each day from May to July are used for the calculation. (The name AOT40 refers to 40ppb which is the same as 80 ug/m3)

Conversion factors from ppb to ug/m3

INTRODUCTION TO AIR POLLUTION

Pollution is now a common place term, that our ears are attuned to. We hear about the various forms of pollution and read about it through the mass media. Air pollution is one such form that refers to the contamination of the air, irrespective of indoors or outside. A physical, biological or chemical alteration to the air in the atmosphere can be termed as pollution. It occurs when any harmful gases, dust, smoke enters into the atmosphere and makes it difficult for plants, animals and humans to survive as the air becomes dirty.

Air pollution can further be classified into two sections- Visible air pollution and invisible air pollution. Another way of looking at Air pollution could be any substance that holds the potential to hinder the atmosphere or the well being of the living beings surviving in it. The sustainment of all things living is due to a combination of gases that collectively form the atmosphere; the imbalance caused by the increase or decrease of the percentage of these gases can be harmful for survival.

Read here more about 40 facts of air pollution.

The Ozone layer considered crucial for the existence of the ecosystems on the planet is depleting due to increased pollution. Global warming, a direct result of the increased imbalance of gases in the atmosphere has come to be known as the biggest threat and challenge that the contemporary world has to overcome in a bid for survival.

Types of Pollutants

In order to understand the causes of Air pollution, several divisions can be made. Primarily air pollutants can be caused by primary sources or secondary sources. The pollutants that are a direct result of the process can be called primary pollutants. A classic example of a primary pollutant would be the sulfur-dioxide emitted from factories

Secondary pollutants are the ones that are caused by the inter mingling and reactions of primary pollutants. Smog created by the interactions of several primary pollutants is known to be as secondary pollutant.

Causes of Air pollution

1. Burning of Fossil Fuels: Sulfur dioxide emitted from the combustion of fossil fuelslike coal, petroleum and other factory combustibles is one the major cause of air pollution. Pollution emitting from vehicles including trucks, jeeps, cars, trains, airplanes cause immense amount of pollution. We rely on them to fulfill our daily basic needs of transportation. But, there overuse is killing our environment as dangerous gases are polluting the environment. Carbon Monooxide caused by improper or incomplete combustion and generally emitted from vehicles is another major pollutant along with Nitrogen Oxides, that is produced from both natural and man made processes.

2. Agricultural activities: Ammonia is a very common by product from agriculture related activities and is one of the most hazardous gases in the atmosphere. Use of insecticides, pesticides and fertilizers in agricultural activities has grown quite a lot. They emit harmful chemicals into the air and can also cause water pollution.

3. Exhaust from factories and industries:Manufacturing industries release large amount of carbon monoxide, hydrocarbons, organic compounds, and chemicals into the air thereby depleting the quality of air. Manufacturing industries can be found at every corner of the earth and there is no area that has not been affected by it. Petroleum refineries also release hydrocarbons and various other chemicals that pollute the air and also cause land pollution.

4. Mining operations: Mining is a process wherein minerals below the earth are extracted using large equipments. During the process dust and chemicals are released in the air causing massive air pollution. This is one of the reason which is responsible for the deteriorating health conditions of workers and nearby residents.

5. Indoor air pollution: Household cleaning products, painting supplies emit toxic chemicals in the air and cause air pollution. Have you ever noticed that once you paint walls of your house, it creates some sort of smell which makes it literally impossible for you to breathe.

Suspended particulate matter popular by its acronym SPM, is another cause of pollution. Referring to the particles afloat in the air, SPM is usually caused by dust, combustion etc.

Effects of Air pollution

1. Respiratory and heart problems: The effects of Air pollution are alarming. They are known to create several respiratory and heart conditions along with Cancer, among other threats to the body. Several millions are known to have died due to direct or indirect effects of Air pollution. Children in areas exposed to air pollutants are said to commonly suffer from pneumonia and asthma.

2. Global warming: Another direct effect is the immediate alterations that the world is witnessing due to Global warming. With increased temperatures world wide, increase in sea levels and melting of ice from colder regions and icebergs, displacement and loss of habitat have already signaled an impending disaster if actions for preservation and normalization aren’t undertaken soon.

3. Acid Rain: Harmful gases like nitrogen oxides and sulfur oxides are released into the atmosphere during the burning of fossil fuels. When it rains, the water droplets combines with these air pollutants, becomes acidic and then falls on the ground in the form of acid rain. Acid rain can cause great damage to human, animals and crops.

4. Eutrophication: Eutrophication is a condition where high amount of nitrogen present in some pollutants gets developed on sea’s surface and turns itself into algae and and adversely affect fish, plants and animal species. The green colored algae that is present on lakes and ponds is due to presence of this chemical only.

5. Effect on Wildlife: Just like humans, animals also face some devastating affects of air pollution. Toxic chemicals present in the air can force wildlife species to move to new place and change their habitat. The toxic pollutants deposit over the surface of the water and can also affect sea animals.

6. Depletion of Ozone layer: Ozone exists in earth’s stratosphere and is responsible for protecting humans from harmful ultraviolet (UV) rays. Earth’s ozone layer is depleting due to the presence of chlorofluorocarbons, hydro chlorofluorocarbons in the atmosphere. As ozone layer will go thin, it will emit harmful rays back on earth and can cause skin and eye related problems. UV rays also have the capability to affect crops.

When you try to study the sources of Air pollution, you enlist a series of activities and interactions that create these pollutants. There are two types of sources that we will take a look at: Natural sources and Man-made sources.

Natural sources of pollution include dust carried by the wind from locations with very little or no green cover, gases released from the body processes of living beings (Carbon dioxide from humans during respiration, Methane from cattle during digestion, Oxygen from plants during Photosynthesis). Smoke from the combustion of various inflammable objects, volcanic eruptions etc along with the emission of polluted gases also make it to the list of Natural sources of Pollution.

While looking at the man-made contributions towards air pollution, smoke again features as a prominent component. The smoke emitted from various forms of combustion like in bio mass, factories, vehicles, furnaces etc. Waste used to create landfills generate methane, that is harmful in several ways. The reactions of certain gases and chemicals also form harmful fumes that can be dangerous to the well being of living creatures.

Solutions for Air Pollution

1. Use public mode of transportation:Encourage people to use more and more public modes of transportation to reduce pollution. Also, try to make use of car pooling. If you and your colleagues come from the same locality and have same timings you can explore this option to save energy and money.

2. Conserve energy: Switch off fans and lights when you are going out. Large amount of fossil fuels are burnt to produce electricity. You can save the environment from degradation by reducing the amount of fossil fuels to be burned.

3. Understand the concept of Reduce, Reuse and Recycle: Do not throw away items that are of no use to you. In-fact reuse them for some other purpose. For e.g. you can use old jars to store cereals or pulses.

4. Emphasis on clean energy resources:Clean energy technologies like solarwindand geothermal are on high these days. Governments of various countries have been providing grants to consumers who are interested in installing solar panels for their home. This will go a long way to curb air pollution.

5. Use energy efficient devices: CFL lights consume less electricity as against their counterparts. They live longer, consume less electricity, lower electricity bills and also help you to reduce pollution by consuming less energy.

Several attempts are being made world wide on a personal, industrial and governmental levels to curb the intensity at which Air Pollution is rising and regain a balance as far as the proportions of the foundation gases are concerned. This is a direct attempt at slacking Global warming. We are seeing a series of innovations and experiments aimed at alternate and unconventional options to reduce pollutants. Air Pollution is one of the larger mirrors of man’s follies, and a challenge we need to overcome to see a tomorrow.

SOLUTIONS TO AIR POLLUTION

Solutions to Air Pollution

To combat pollution in the United States, the Clean Air Act Amendments of 1970 gave the Environmental Protection Agency (EPA) the authority to establish and enforce air pollution standards and to set emission standards for new factories and extremely hazardous industrial pollutants. The states were required to meet “ambient air quality standards” by regulating the emissions of various pollutants from existing stationary sources, such as power plants and incinerators, in part by the installation of smokestack scrubbers, electrostatic precipitators, and other filters. Auto manufacturers were mandated to install exhaust controls or develop less polluting engines. The Clean Air Act, as amended in 1977, authorized the EPA to impose stricter pollution standards and higher penalties for failure to comply with air quality standards.

In 1990 when the act was reauthorized it required most cities to meet existing smog reduction regulations by the year 2005. The 1990 amendments also expanded the scope and strength of the regulations for controlling industrial pollution. The result has been limited progress in reducing the quantities of sulfur dioxide, carbon monoxide, nitrogen oxide, ozone, particulate matter, and lead in the air. The EPA also regulated hazardous air pollutants, which in 1992 included mercury, beryllium, asbestos, vinylchloride, benzene, radioactive substances, and inorganic arsenic.

The most satisfactory long-term solutions to air pollution may well be the elimination of fossil fuels and the ultimate replacement of the internal-combustion engine. To these ends efforts have begun in the United States, Japan, and Europe to develop alternative energy sources (see energy, sources of), as well as different kinds of transportation engines, such as one powered by electricity. A system of pollution allowances based on trading emission rights has been established in the United States in an attempt to use the free market to reward pollution reductions, and the international sale of surplus emission rights is permitted under the Kyoto Protocol (see below). Other proposed solutions include raising electricity and gasoline rates to better reflect environmental costs and to discourage waste and inefficiency, and mechanical controls on coal-fired utility plants.

In 1992, 150 nations signed a treaty on global warming at the UN-sponsored summit on the environment in Rio de Janeiro. A UN Conference on Climate Change, held in Kyoto, Japan, in 1997, produced an international agreement to combat global warming by sharply reducing emissions of industrial gases produced by industrialized nations. Although the United States abandoned the treaty in 2001, saying it was counter to U.S. interests, most other nations agreed that year on the details necessary to make the protocol a binding international treaty, and the necessary ratifications brought the treaty into force in 2005. Efforts to develop a new, more encompassing binding treaty that would build on the Kyoto Protocol have been unsuccessful, and in 2012 Canada became the first ratifying nation to withdraw. Later in 2012 the Kyoto Protocol was extended to 2020.

EFFECTS OF HEALTH AND ENVIRONMENT

Effects on Health and the Environment

Like photochemical pollutants, sulfur oxides contribute to the incidence of respiratory diseases. Acid rain, a form of precipitation that contains high levels of sulfuric or nitric acids, can contaminate drinking water and vegetation, damage aquatic life, and erode buildings. When a weather condition known as a temperature inversion prevents dispersal of smog, inhabitants of the area, especially children and the elderly and chronically ill, are warned to stay indoors and avoid physical stress. The dramatic and debilitating effects of severe air pollution episodes in cities throughout the world—such as the London smog of 1952 that resulted in 4,000 deaths—have alerted governments to the necessity for crisis procedures. Even everyday levels of air pollution may insidiously affect health and behavior. Indoor air pollution is a problem in developed countries, where efficient insulation keeps pollutants inside the structure. In less developed nations, the lack of running water and indoor sanitation can encourage respiratory infections. Carbon monoxide, for example, by driving oxygen out of the bloodstream, causes apathy, fatigue, headache, disorientation, and decreased muscular coordination and visual acuity.

Air pollution may possibly harm populations in ways so subtle or slow that they have not yet been detected. For that reason research is now under way to assess the long-term effects of chronic exposure to low levels of air pollution—what most people experience—as well as to determine how air pollutants interact with one another in the body and with physical factors such as nutrition, stress, alcohol, cigarette smoking, and common medicines. Another subject of investigation is the relation of air pollution to cancerbirth defects, and genetic mutations.

A relatively recently discovered result of air pollution are seasonal “holes” in the ozone layer in the atmosphere above Antarctica and the Arctic, coupled with growing evidence of global ozone depletion. This can increase the amount of ultraviolet radiation reaching the earth, where it damages crops and plants and can lead to skin cancer and cataracts. This depletion has been caused largely by the emission of chlorofluorocarbons (CFCs) from refrigerators, air conditioners, and aerosols. The Montreal Protocol of 1987 required that developed nations signing the accord not exceed 1986 CFC levels. Several more meetings were held from 1990 to 1997 to adopt agreements to accelerate the phasing out of ozone-depleting substances.

SOURCE OF AIR POLLUTION

Sources of Air Pollution

The combustion of gasolineand other hydrocarbon fuels in automobiles, trucks, and jet airplanes produces several primary pollutants: nitrogen oxides, gaseous hydrocarbons, and carbon monoxide, as well as large quantities of particulates, chiefly lead. In the presence of sunlight, nitrogen oxides combine with hydrocarbons to form a secondary class of pollutants, the photochemical oxidants, among them ozone and the eye-stinging peroxyacetylnitrate (PAN). Nitrogen oxides also react with oxygen in the air to form nitrogen dioxide, a foul-smelling brown gas. In urban areas like Los Angeles where transportation is the main cause of air pollution, nitrogen dioxide tints the air, blending with other contaminants and the atmospheric water vapor to produce brown smog. Although the use of catalytic converters has reduced smog-producing compounds in motor vehicle exhaust emissions, studies have shown that in so doing the converters produce nitrous oxide, which contributes substantially to global warming.

In cities, air may be severely polluted not only by transportation but also by the burning of fossil fuels (oil and coal) in generating stations, factories, office buildings, and homes and by the incineration of garbage. The massive combustion produces tons of ash, soot, and other particulates responsible for the gray smog of cities like New York and Chicago, along with enormous quantities of sulfur oxides (which also may be result from burning coal and oil). These oxides rust iron, damage building stone, decompose nylon, tarnish silver, and kill plants. Air pollution from cities also affects rural areas for many miles downwind.

Every industrial process exhibits its own pattern of air pollution. Petroleum refineries are responsible for extensive hydrocarbon and particulate pollution. Iron and steel mills, metal smelters, pulp and paper mills, chemical plants, cement and asphalt plants—all discharge vast amounts of various particulates. Uninsulated high-voltage power lines ionize the adjacent air, forming ozone and other hazardous pollutants. Airborne pollutants from other sources include insecticidesherbicides, radioactive fallout, and dust from fertilizers, mining operations, and livestock feedlots.

LIST OF POLLUTANTS

List of Pollutants

Common types of pollutants inlcude air, water and soil pollutants.

Below is a summary of most common air, water and soil pollutants.

Air Pollutants

    • Sulfur dioxide
    • Nitrogen oxides
    • Ammonia
    • Carbon monoxide
    • Volatile Organic Compounds (VOCs)
    • Ozone
    • Persistent Organic Pollutants (POPs)
    • Airborne particles
    • Toxic metals
    • Radioactive pollutants

Water Pollutants (Ref. 1)

Organic water pollutants:

  • Insecticides and herbicides, a range of organohalide
  • Bacteria from livestock operations
  • Food processing waste incl. pathogens
  • Tree debris from logging operations
  • VOCs including solvents and hydrocarbons
  • Dense non-aqueous phase liquids (DNAPLs) such as chlorinated solvents
  • Detergents and chemical compounds found in cosmetics products

Inorganic water pollutants:

  • Heavy metals
  • Acidity caused by industrial discharges such as sulfur dioxide by power plants
  • Chemical waste
  • Fertilizers from agricultural use
  • Silt from construction sites, logging, slash and burn operation

Soil Pollutants (Contaminants) (Ref. 2)

    • Hydrocarbons
    • Solvents
    • Pesticides
    • Lead and other heavy metals

OPERATIONS FOR WATER TREATMENT

Water Treatment Process and Unit Operation

Water treatment involves removal of undesirable constituents from water and them disposal of them in easiest and safest manner. To achieve these goals, a variety of treatment operation and process are utilized, which exploit various physical and chemical phenomena to remove or reduce the undeliverable constituents from water. Those operation used in this treatment of water in which change is brought about by means of or through application of physical forces are known as Unit operation (UO). Those process used for the treatment of water in which change is brought about by means of chemical reaction are known as Unit Process (UP).