Category Archives: GEOMATICS ENGINEERING

GPS

What is GPS?

The global positioning system is a satellite-based navigation system consisting of a network of 24 orbiting satellites that are eleven thousand nautical miles in space and in six different orbital paths. The satellites are constantly moving, making two complete orbits around the Earth in just under 24 hours. If you do the math, that’s about 2.6 kilometers per second. That’s really moving! 

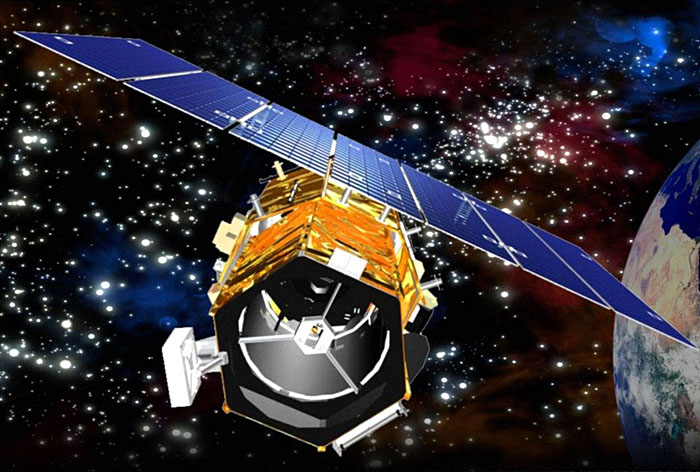
The GPS satellites are referred to as NAVSTAR satellites. Of course, no GPS introduction would be complete without learning the really neat stuff about the satellites too! The first GPS satellite was launched way back in February, 1978. 

Each satellite weighs approximately 1 tonne and is about 5 metres across with the solar panels extended. Transmitter power is only 50 watts, or less!
Each satellite transmits on three frequencies. Civilian GPS uses the ‘L1’ frequency of 1575.42 MHz. 
Each satellite is expected to last approximately 10 years. Replacements are constantly being built and launched into orbit. The satellite orbits are roughly 25,000 kilometers from the earth’s centre, or 20,000 kms above the earth’s surface. 

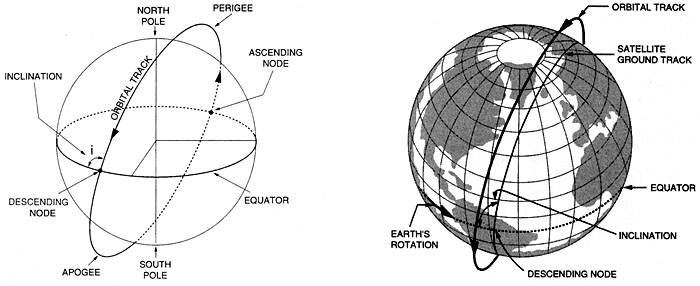
The orbital paths of these satellites take them between roughly 60 degrees North and 60 degrees South latitudes. What this means is you can receive satellite signals anywhere in the world, at any time. As you move closer to the poles (on your next North Pole or Antarctic expedition!), you will still pick up the GPS satellites. They just won’t be directly overhead anymore. This may affect the satellite geometry and accuracy but only slightly. 
One of the biggest benefits over previous land-based navigation systems is GPS works in all weather conditions. No matter what your application is, when you need it the most, when you’re most likely to get lost, your GPS receiver will keep right on working, showing right where you are! 

Type 2R SatelliteHow did the technology evolve? You know from your history books that Mr Marconi figured greatly in the understanding of the electro-magnetic energy we know as radio. This technology was applied during the 1920’s by the establishment of radio stations, for which you needed a receiver. The same applies for GPS- you only need a rather special radio receiver. Significant advances in radio were bolstered by large sums of money during and after the Second World War (for eavesdroppping and communications necessities), and were even more advanced by the need for communications with early satellites and rockets, and general space exploration. The technology to receive radio signals in a small hand-held, from 20,000kms away, is indeed amazing. 

So what information does a GPS satellite transmit? The GPS signal contains a ‘pseudo-random code’, ephemeris (pronounced: ee-fem-er-iss) and almanac data. The pseudo-random code identifies which satellite is transmitting – in other words, an I.D. code. Ephemeris data is constantly transmitted by each satellite and contains important information such as status of the satellite (healthy or unhealthy), current date, and time. Without this part of the message, your GPS receiver would have no idea what the current time and date are. This part of the signal is essential to determining a position, as we’ll see in a moment. 

The almanac data tells the GPS receiver where each GPS satellite should be at any time throughout the day. Each satellite transmits almanac data showing the orbital information for that satellite and for every other satellite in the system. 
By now the overall picture of how GPS works should be getting much clearer. (Clear as mud, right?) Each satellite transmits a message which essentially says, “I’m satellite #X, my position is currently Y, and this message was sent at time Z.” Of course, this is a gross oversimplification, but you get the idea. Your GPS receiver reads the message and saves the ephemeris and almanac data for continual use. This information can also be used to set (or correct) the clock within the GPS receiver. 
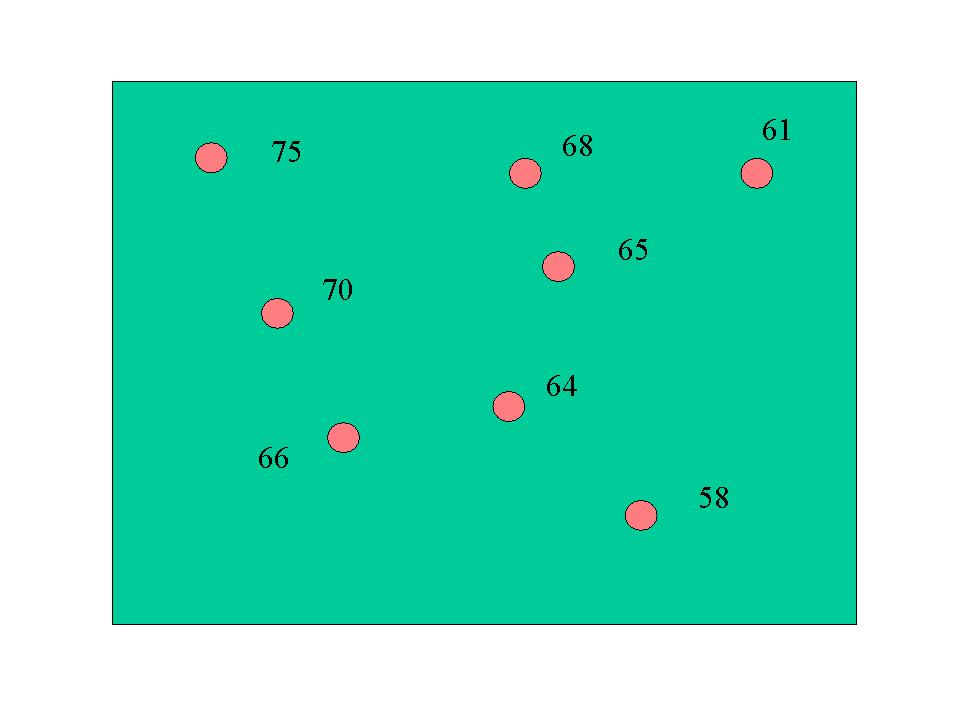
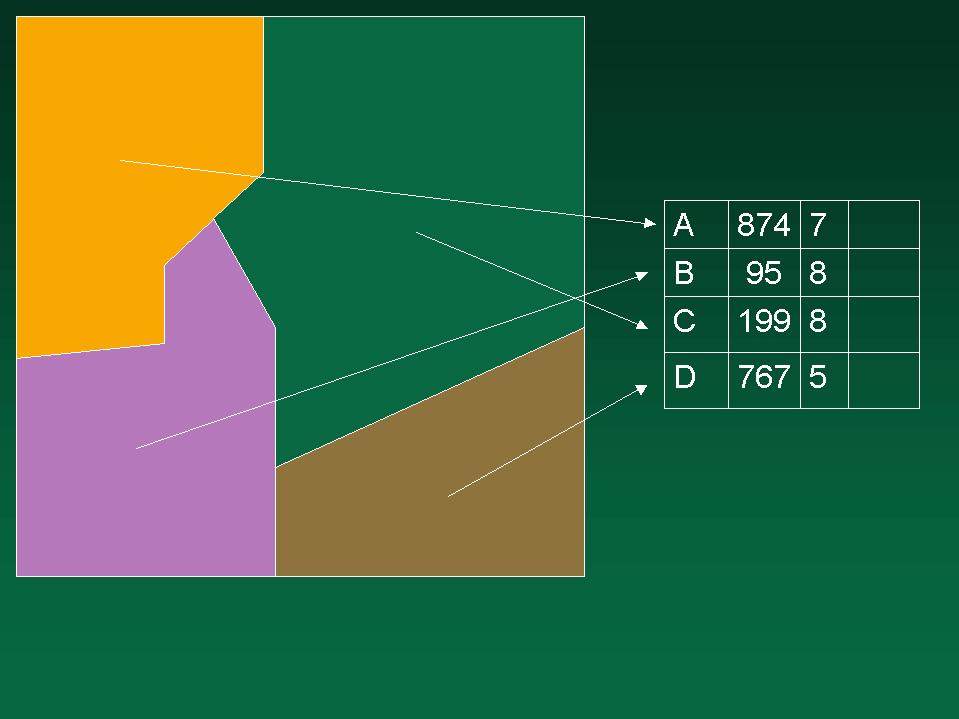
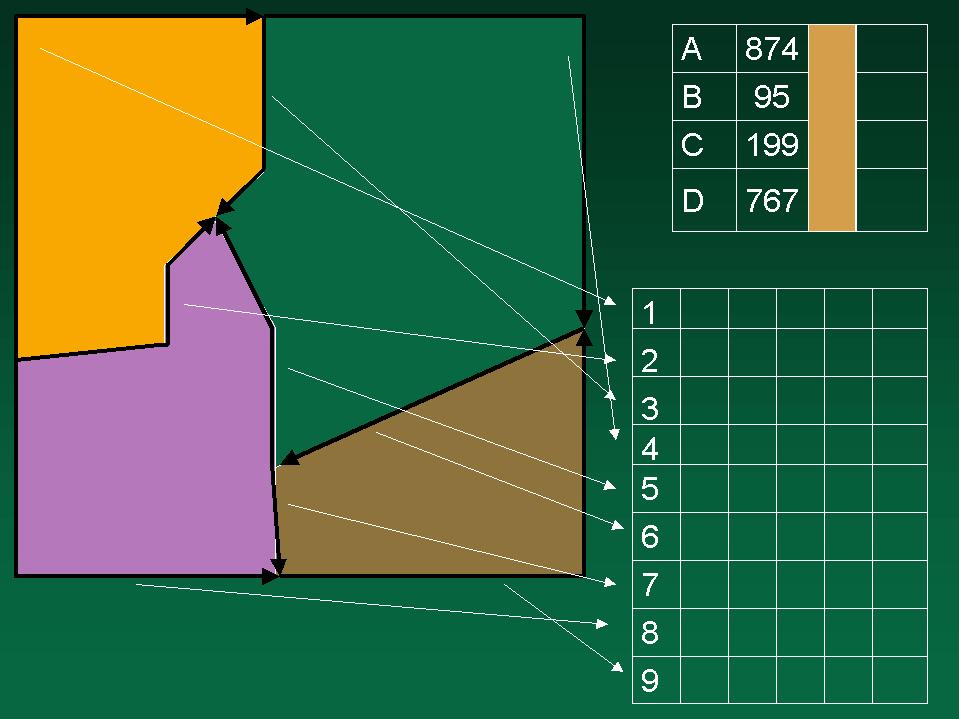
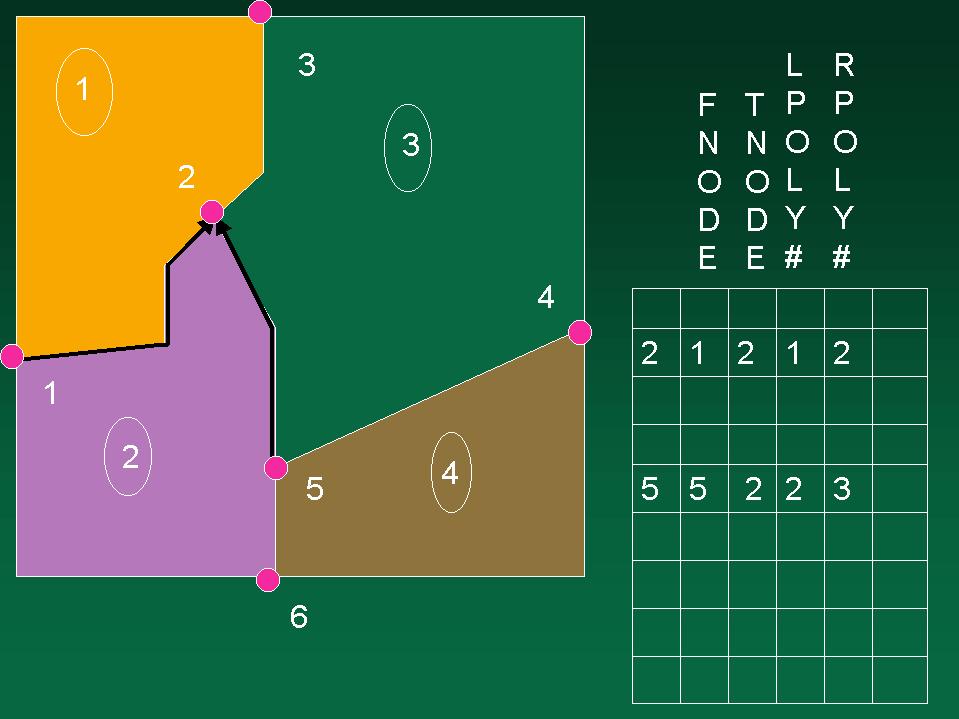
Now, to determine your position the GPS receiver compares the time a signal was transmitted by a satellite with the time it was received by the GPS receiver. The time difference tells the GPS receiver how far away that particular satellite is. If we add distance measurements from a few more satellites, we can triangulate our position. This is exactly what a GPS receiver does. With a minimum of three satellites, your GPS receiver can determine a latitude/longitude position – what’s called a 2D position fix. With four or more satellites, a GPS receiver can determine a 3D position which includes latitude, longitude, and altitude. By continuously updating your position, a GPS receiver can also accurately provide speed and direction of travel (referred to as ‘ground speed’ and ‘ground track’). 

Accuracy is a relative term of course. If you want to locate a fishing spot, 10 metres is probably fine. But if you want to determine a survey boundary peg, we might need 2 cms. 10 metres, as it happens is fairly typical of current GPS accuracy (since 1 May 2000). The first source of position error used to be Selective Availability (or SA), but as of 1 May 2000, this was deliberately cancelled. SA created inaccuracies up to 100 metres in an intentionally-imposed degradation on the accuracy of civilian GPS by the U.S. Department of Defense. The rationale behind SA was to deny hostile military or terrorist organizations the maximum accuracy benefits of GPS. Now that SA is gone, we can look forward to more productive and safer use of GPS. 
Other factors will effect accuracy, but may become significant only when looking for accuracies better than 10-15 metres. These factors are satellite geometry (relative positions of each satellite in the sky, units expressed as DOP), multi-pathing (where satellite reception is blocked or reflected by buildings etc), and propagation delay due to atmospheric effects. There will also be internal clock errors. These latter errors will normally have no significance for 10-15 metre users.

BASIC CONCEPT OF GIS

OUTLINE

1. GEOGRAPHIC REPRESENTATION

2. THE FUNDAMENTAL PROBLEM

3. OBJECTS AND FIELDS

4. GIS DATA MODELS

5. THE NATURE OF GEOGRAPHIC INFORMATION


1. GEOGRAPHIC REPRESENTATION

Geographic information

information about some place on the surface of the Earth

or near the surfaceat some point in time

one of the earliest forms of shared information

hunters and gatherers reporting back to the band“there’s good hunting near the old tree”

early stick maps for navigation in the Pacific

drawings on cave walls

storing on paper

the printing press in the 15th Centuryinformation accessible to all

shared knowledge as a human community asset

Prince Henry the Navigator, 1394-1460

The Internet

massive new capability for sharing, communicating geographic information

in digital form

paradigm change

from GIS as the personal engine performing calculations on datato GIS as the medium for communicating knowledge of the planet

humans work in a vague world

GIS as a precise medium acts as a filtercommunicating a vague fact


2. THE FUNDAMENTAL PROBLEM

The atom of geographic information

<location, time, attribute>

it’s cold today in Ottawaat 45 North, 75 East at 12 noon EST the temperature was -10 Celsius

general methods for describing location

everyone around the world understands latitude and longitudesimilarly for time

attributes must also be generally understood

“cold” is subjective and relative-10 Celsius is generally understood

Suppose we could capture it all

complete representation of the planetpast, present, and future

a “mirror world”

Al Gore’s dream of a Digital Earth

“Imagine, for example, a young child going to a Digital Earth exhibit at a local museum. After donning 
a head-mounted display, she sees Earth as it appears from space. Using a data glove, she zooms in, 
using higher and higher levels of resolution, to see continents, then regions, countries, cities, and 
finally individual houses, trees, and other natural and man-made objects. Having found an area of the 
planet she is interested in exploring, she takes the equivalent of a ‘magic carpet ride’ through a 3-D 
visualization of the terrain. Of course, terrain is only one of the numerous kinds of data with which she 
can interact. Using the system’s voice recognition capabilities, she is able to request information on 
land cover, distribution of plant and animal species, real-time weather, roads, political boundaries, and 
population. She can also visualize the environmental information that she and other students all over 
the world have collected as part of the GLOBE project. This information can be seamlessly fused with 
the digital map or terrain data. She can get more information on many of the objects she sees by using 
her data glove to click on a hyperlink. To prepare for her family’s vacation to Yellowstone National 
Park, for example, she plans the perfect hike to the geysers, bison, and bighorn sheep that she has just 
read about. In fact, she can follow the trail visually from start to finish before she ever leaves the 
museum in her hometown. 
She is not limited to moving through space, but can also travel through time. After taking a virtual 
field-trip to Paris to visit the Louvre, she moves backward in time to learn about French history, 
perusing digitized maps overlaid on the surface of the Digital Earth, newsreel footage, oral history, 
newspapers and other primary sources. She sends some of this information to her personal e-mail 
address to study later. The time-line, which stretches off in the distance, can be set for days, years, 
centuries, or even geological epochs, for those occasions when she wants to learn more about 
dinosaurs.” (U.S. Vice President Al Gore, in a speech written for presentation at the California Science 
Museum, Los Angeles, January 1998)

www.digitalearth.gov

How many atoms are there?

an infinite numberto make a two-word description of every sq km on the planet would require 10 Gigabytes

to store one number for every sq m on the planet would require 1 Petabyte

that’s too many for any system

how to limit?

Reduce the level of detail, aggregate, generalize, approximate

ignore the water

that’s 2/3 of the planet

one temperature for all of Ottawa

one number for an entire areadefinition of the area is shared and implicit

definition of the area is finite and digital

sample the space

only measure at weather stationsbecause temperature varies slowly

all geographic data miss detail

all are uncertain to some degreeall geographic phenomena vary slowly

The problem

there are many ways of doing thisa GIS user must make choices

GIS designers must allow for many options

geographic description is complex

description of the differences between a representation and the truth can be as important as the representation

need to know what is missing

e.g. a space-time representation

the uncertainty about reality associated with a representation


3. OBJECTS AND FIELDS

The most important of the options

how we think about the worldhow we interpret the contents of a database

not inherent in the database

Discrete objects

points, lines, areas (or volumes) having known propertieslittering an otherwise empty space

may overlap

can be counted

how many lakes are there in Minnesota?how many mountains in Scotland over 3000 ft?

how many clouds in the sky?

how many cities over 1 million population?

how many atmospheric lows in the northern hemisphere today?

represent as shapefiles

pointspolylines

polygons

Fields

things it’s worth measuring at every location on the planet

temperaturesoil pH

soil type

land cover type

elevation

source of language, metaphordid Newton, Leibnitz think that way?

rainfallownership

population density

explicit scale (property of convolution)

each of these variables has one value everywherevariable is a function of location

field = a way of conceiving of geography as a set of variables each having one value at every location on the planet

z = f(x,y,z,t)

six alternative representations:

a raster of pointssample points (weather stations)

a triangulated irregular network

a raster of cells

a coverage

contours

Lakes in Minnesota

how many are there?

Weather forecasting

fronts, highs, lows, or pressure surfaces?

Objects are intuitive, part of everyday life

fields are more associated with science

Both objects and fields can be represented either in raster or in vector form

two point-data sets


4. DATA MODELS

Discrete object implementations

shapefiles

ArcView

collections of points, lines, and areas

Six types of shapefiles

point

multipoint

polyline

a line made by connecting points with straight linesmultipart polyline

polygon

an area made by connecting points with straight linesmultipart polygon

slideslide

Field implementations

coveragesthe relational model applied to GIS

the georelational modelrepresenting maps in the relational model

ARC/INFO circa 1980

Components:

polygonsarcs

nodes

Coverage slide 1

Coverage slide 2

Coverage slide 3

Using arcs as the basic unit

avoids double representation of internal boundaries

easier to build the databaseeasier to edit and maintain

keeps track of ‘topology’

which nodes are connected by which arcswhich polygons are separated by which arcs

Distinct behavior of shapefiles and coverages

Data that fit the coverage model

all points within one polygon have the same attributesall points must lie in exactly one polygon

resource management

forest standssoil type

soil map

vegetation cover classland use class

the cadaster

land ownership parcels

demographics

census datadata by state

data by county

marketing data by market area

population by ZIP

the choropleth mapthe area class map

coverages capture the field view of the world

a continuous worldone value of a variable at every point

sharp changes in value as boundaries are crossed

other types of coverages (classic ARC/INFO)

pointslines

arcs

TINsgrids


5. THE NATURE OF GEOGRAPHIC INFORMATION

What is generally true about geographic information?

are there laws of geographic information?

principles that are generally true?

are there empirical laws of GIScience?

principles that are generally (but not always) true?

principles useful in system design and testing


Anselin

two generic properties

spatial dependence

spatial heterogeneity

Spatial dependence

Tobler’s First Law of Geography

all things are related, but nearby things are more related than distant things


the basis of all weather forecasting, spatial interpolation of any kind

imagine a world in which it is not true

nearby things are as different as distant things

all global variation occurs over an infinitesimal distance


positive spatial autocorrelation

negative is possible at certain scales


the checkerboard


The second (first law)

a law of spatial heterogenity

conditions vary (smoothly) over the Earth’s surface

corollary: the further you look the more you see

the Noah effect

a spatial equivalent: the El Dorado effect


corollary: global standards and local standards will always differ

corollary: there is no average place

Are there other laws?

a fractal law

the closer you look the more you see

additional detail is revealed at a predictable rate

Richardson plots

partitioning of variance with scale


an uncertainty law

it is impossible to measure location perfectly

two datasets of different lineage will always disagree

relative accuracy will always be better than absolute accuracy

(corollary of the first and uncertainty laws)


VISUAL IMAGE INTERPRETATION

Elements of Visual Interpretation

As we noted in the previous section, analysis of remote sensing imagery involves the identification of various targets in an image, and those targets may be environmental or artificial features which consist of points, lines, or areas. Targets may be defined in terms of the way they reflect or emit radiation. This radiation is measured and recorded by a sensor, and ultimately is depicted as an image product such as an air photo or a satellite image.

What makes interpretation of imagery more difficult than the everyday visual interpretation of our surroundings? For one, we lose our sense of depth when viewing a two-dimensional image, unless we can view it stereoscopically so as to simulate the third dimension of height. Indeed, interpretation benefits greatly in many applications when images are viewed in stereo, as visualization (and therefore, recognition) of targets is enhanced dramatically. Viewing objects from directly above also provides a very different perspective than what we are familiar with. Combining an unfamiliar perspective with a very different scale and lack of recognizable detail can make even the most familiar object unrecognizable in an image. Finally, we are used to seeing only the visible wavelengths, and the imaging of wavelengths outside of this window is more difficult for us to comprehend.

Recognizing targets is the key to interpretation and information extraction. Observing the differences between targets and their backgrounds involves comparing different targets based on any, or all, of the visual elements of tone, shape, size, pattern, texture, shadow, and association. Visual interpretation using these elements is often a part of our daily lives, whether we are conscious of it or not. Examining satellite images on the weather report, or following high speed chases by views from a helicopter are all familiar examples of visual image interpretation. Identifying targets in remotely sensed images based on these visual elements allows us to further interpret and analyze. The nature of each of these interpretation elements is described below, along with an image example of each.

image showing the variations in tone

Tone refers to the relative brightness or colour of objects in an image. Generally, tone is the fundamental element for distinguishing between different targets or features. Variations in tone also allows the elements of shape, texture, and pattern of objects to be distinguished.

image showing that shape can be a very distinctive clue for interpretation

Shape refers to the general form, structure, or outline of individual objects. Shape can be a very distinctive clue for interpretation. Straight edge shapes typically represent urban or agricultural (field) targets, while natural features, such as forest edges, are generally more irregular in shape, except where man has created a road or clear cuts. Farm or crop land irrigated by rotating sprinkler systems would appear as circular shapes.

size of objects in an image is a function of scale

Size of objects in an image is a function of scale. It is important to assess the size of a target relative to other objects in a scene, as well as the absolute size, to aid in the interpretation of that target. A quick approximation of target size can direct interpretation to an appropriate result more quickly. For example, if an interpreter had to distinguish zones of land use, and had identified an area with a number of buildings in it, large buildings such as factories or warehouses would suggest commercial property, whereas small buildings would indicate residential use.

pattern refers to the spatial arrangement of visibly discernible objects

Pattern refers to the spatial arrangement of visibly discernible objects. Typically an orderly repetition of similar tones and textures will produce a distinctive and ultimately recognizable pattern. Orchards with evenly spaced trees, and urban streets with regularly spaced houses are good examples of pattern.

Texture refers to the arrangement and frequency of tonal variation in particular areas of an image

Texture refers to the arrangement and frequency of tonal variation in particular areas of an image. Rough textures would consist of a mottled tone where the grey levels change abruptly in a small area, whereas smooth textures would have very little tonal variation. Smooth textures are most often the result of uniform, even surfaces, such as fields, asphalt, or grasslands. A target with a rough surface and irregular structure, such as a forest canopy, results in a rough textured appearance. Texture is one of the most important elements for distinguishing features in radar imagery.

Shadows may provide an idea of the profile and relative height of a target or targets which may make identification easier

Shadow is also helpful in interpretation as it may provide an idea of the profile and relative height of a target or targets which may make identification easier. However, shadows can also reduce or eliminate interpretation in their area of influence, since targets within shadows are much less (or not at all) discernible from their surroundings. Shadow is also useful for enhancing or identifying topography and landforms, particularly in radar imagery.

Association takes into account the relationship between other recognizable objects or features in proximity to the target of interest

Association takes into account the relationship between other recognizable objects or features in proximity to the target of interest. The identification of features that one would expect to associate with other features may provide information to facilitate identification. In the example given above, commercial properties may be associated with proximity to major transportation routes, whereas residential areas would be associated with schools, playgrounds, and sports fields. In our example, a lake is associated with boats, a marina, and adjacent recreational land.

Did you know?

Sometimes the 'impression' that a buried artifact, such as an ancient fort foundation, leaves on the surface, can be detected and identified

“…What will they think of next ?!…”

Remote sensing (image interpretation) has been used for archeological investigations. Sometimes the ‘impression’ that a buried artifact, such as an ancient fort foundation, leaves on the surface, can be detected and identified. That surface impression is typically very subtle, so it helps to know the general area to be searched and the nature of the feature being sought. It is also useful if the surface has not been disturbed much by human activities.

Whiz quiz

Aerial photograph

Take a look at the aerial photograph above. Identify the following features in the image and explain how you were able to do so based on the elements of visual interpretation described in this section.

  • race track
  • river
  • roads
  • bridges
  • residential area
  • dam

The answer is …

Whiz quiz – answer

Aerial photograph

  • The race track in the lower left of the image is quite easy to identify because of its characteristic shape.
  • The river is also easy to identify due to its contrasting tone with the surrounding land and also due to its shape.
  • The roads in the image are visible due to their shape (straight in many cases) and their generally bright tone contrasting against the other darker features.
  • Bridges are identifiable based on their shape, tone, and association with the river – they cross it!
  • Residential areas on the left hand side of the image and the upper right can be identified by the pattern that they make in conjunction with the roads. Individual houses and other buildings can also be identified as dark and light tones.
  • The dam in the river at the top center of the image can be identified based on its contrasting tone with the dark river, its shape, and its association with the river – where else would a dam be!


REMOTE SENSORS

Remote Sensing Platforms Using the broadest definition of remote sensing, there are innumerable types of platforms upon which to deploy an instrument. Discussion in this course will be limited to the commercial platforms and sensors most commonly used in mapping and GIS applications. Satellites and aircraft collect the majority of base map data and imagery used in GIS; the sensors typically deployed on these platforms include film and digital cameras, light-detection and ranging (lidar) systems, synthetic aperture radar (SAR) systems, multispectral and hyperspectral scanners. Many of these instruments can also be mounted on land-based platforms, such as vans, trucks, tractors, and tanks. In the future, it is likely that a significant percentage of GIS and mapping data will originate from land-based sources; however, due to time constraints, we will only cover satellite and aircraft platforms in this course.

Since the launch of the first Landsat in 1972, satellite-based remote sensing and mapping has grown into an international commercial industry. Interestingly enough, even as more satellites are launched, the demand for data acquired from airborne platforms continues to grow. The historic and growth trends for both airborne and spaceborne remote sensing are well-documented in the ASPRS Ten-Year Industry Forecast(link is external)pdf icon. The well-versed geospatial intelligence professional should be able to discuss the advantages and disadvantages for each type of platform. He/she should also be able to recommend the appropriate data acquisition platform for a particular application and problem set. While the number of satellite platforms is quite low compared to the number of airborne platforms, the optical capabilities of satellite imaging sensors are approaching those of airborne digital cameras. However, there will always be important differences, strictly related to characteristics of the platform, in the effectiveness of satellites and aircraft to acquire remote sensing data.

One obvious advantage satellites have over aircraft is global accessibility; there are numerous governmental restrictions that deny access to airspace over sensitive areas or over foreign countries. Satellite orbits are not subject to these restrictions, although there may well be legal agreements to limit distribution of imagery over particular areas.

The design of a sensor destined for a satellite platform begins many years before launch and cannot be easily changed to reflect advances in technology that may evolve during the interim period. While all systems are rigorously tested before launch, there is always the possibility that one or more will fail after the spacecraft reaches orbit. The sensor could be working perfectly, but a component of the spacecraft bus (attitude determination system, power subsystem, temperature control system, or communications system) could fail, rendering a very expensive sensor effectively useless. The financial risk involved in building and operating a satellite sensor and platform is considerable, presenting a significant obstacle to the commercialization of space-based remote sensing.

Artist's rendition of the GeoEye-1 high-resolution commercial imaging satellite in orbit

Figure 2.01: Artist’s rendition of the GeoEye-1 high-resolution commercial imaging satellite in orbit.

SOURCE: GeoEye.

Satellites are placed at various heights and orbits to achieve desired coverage of the Earth’s surface(link is external). When the orbital speed exactly matches that of the Earth’s rotation, the satellite stays above the same point at all times, in a geostationary(link is external) orbit. This is useful for communications and weather monitoring satellites Satellite platforms for electro-optical (E/O) imaging systems are usually placed in a sun-synchronous(link is external), low-earth orbit (LEO) so that images of a given place are always acquired at the same local time (Figure 2.02). The revisit time for a particular location is a function of the individual platform and sensor, but generally it is on the order of several days to several weeks. While orbits are optimized for time of day, the satellite track may not always coincide with cloud-free conditions or specific vegetation conditions of interest to the end-user of the imagery. Therefore, it is not a given that usable imagery will be collected on every sensor pass over a given site

Satellite orbits: definition of terms (left), sun-synchronous orbit (right)

Figure 2.02: Satellite orbits: definition of terms (left), sun-synchronous orbit (right).

SOURCE: Campbell, 2007.

Aircraft often have a definite advantage because of their mobilization flexibility. They can be deployed wherever and whenever weather conditions are favorable. Clouds often appear and dissipate over a target over a period of several hours during a given day. Aircraft on site can respond with a moment’s notice to take advantage of clear conditions, while satellites are locked into a schedule dictated by orbital parameters. Aircraft can also be deployed in small or large numbers, making it possible to collect imagery seamlessly over an entire county or state in a matter of days or weeks simply by having lots of planes in the air at the same time.

Aircraft platforms range from the very small, slow, and low flying (Figure 2.03), to twin-engine turboprop and small jets capable of flying at altitudes up to 35,000 feet. Unmanned platforms (UAVs) are becoming increasingly important, particularly in military and emergency response applications, both international and domestic. Flying height, airspeed, and range are critical factors in choosing an appropriate remote sensing platform, and you will learn about this in more detail later in the lesson. Modifications to the fuselage and power system to accommodate a remote sensing instrument and data storage system are often far more expensive than the cost of the aircraft itself. While the planes themselves are fairly common, choosing the right aircraft to invest in requires a firm understanding of the applications for which that aircraft is likely to be used over its lifetime.

Image of a Helio Courier

Figure 2.03: Helio Courier.

SOURCE: Fugro EarthData.

Image of a Cessna Conquest

Figure 2.04: Cessna Conquest.

SOURCE: Fugro EarthData.

The scale and footprint of an aerial image is determined by the distance of the sensor from the ground; this distance is commonly referred to as the altitude above the mean terrain (AMT). The operating ceiling for an aircraft is defined in terms of altitude above mean sea level. It is important to remember this distinction when planning for a project in mountainous terrain. For example, the National Aerial Photography Program(link is external) (NAPP) and the National Agricultural Imagery Program(link is external) (NAIP) both call for imagery to be acquired from 20,000 feet AMT. In the western United States, this often requires flying much higher than 20,000 feet above mean sea level. A pressurized platform such as the Cessna Conquest (Figure 2.04) would be suitable for meeting these requirements.

With airborne systems, the flying height is determined on a project-by-project basis depending on the requirements for spatial resolution, GSD, and accuracy. The altitude of a satellite platform is fixed by the orbital considerations described above; scale and resolution of the imagery are determined by the sensor design. Medium resolution satellites, such as Landsat, and high-resolution satellites, such as GeoEye, orbit at nearly the same altitude, but collect imagery at very different ground sample distance (GSD).

REMOTE SENSING PLATFORMS

Remote Sensing Platforms

PrintPrint

Using the broadest definition of remote sensing, there are innumerable types of platforms upon which to deploy an instrument. Discussion in this course will be limited to the commercial platforms and sensors most commonly used in mapping and GIS applications. Satellites and aircraft collect the majority of base map data and imagery used in GIS; the sensors typically deployed on these platforms include film and digital cameras, light-detection and ranging (lidar) systems, synthetic aperture radar (SAR) systems, multispectral and hyperspectral scanners. Many of these instruments can also be mounted on land-based platforms, such as vans, trucks, tractors, and tanks. In the future, it is likely that a significant percentage of GIS and mapping data will originate from land-based sources; however, due to time constraints, we will only cover satellite and aircraft platforms in this course.

Since the launch of the first Landsat in 1972, satellite-based remote sensing and mapping has grown into an international commercial industry. Interestingly enough, even as more satellites are launched, the demand for data acquired from airborne platforms continues to grow. The historic and growth trends for both airborne and spaceborne remote sensing are well-documented in the ASPRS Ten-Year Industry Forecast(link is external)pdf icon. The well-versed geospatial intelligence professional should be able to discuss the advantages and disadvantages for each type of platform. He/she should also be able to recommend the appropriate data acquisition platform for a particular application and problem set. While the number of satellite platforms is quite low compared to the number of airborne platforms, the optical capabilities of satellite imaging sensors are approaching those of airborne digital cameras. However, there will always be important differences, strictly related to characteristics of the platform, in the effectiveness of satellites and aircraft to acquire remote sensing data.

One obvious advantage satellites have over aircraft is global accessibility; there are numerous governmental restrictions that deny access to airspace over sensitive areas or over foreign countries. Satellite orbits are not subject to these restrictions, although there may well be legal agreements to limit distribution of imagery over particular areas.

The design of a sensor destined for a satellite platform begins many years before launch and cannot be easily changed to reflect advances in technology that may evolve during the interim period. While all systems are rigorously tested before launch, there is always the possibility that one or more will fail after the spacecraft reaches orbit. The sensor could be working perfectly, but a component of the spacecraft bus (attitude determination system, power subsystem, temperature control system, or communications system) could fail, rendering a very expensive sensor effectively useless. The financial risk involved in building and operating a satellite sensor and platform is considerable, presenting a significant obstacle to the commercialization of space-based remote sensing.

Artist's rendition of the GeoEye-1 high-resolution commercial imaging satellite in orbit

Figure 2.01: Artist’s rendition of the GeoEye-1 high-resolution commercial imaging satellite in orbit.

SOURCE: GeoEye.

Satellites are placed at various heights and orbits to achieve desired coverage of the Earth’s surface(link is external). When the orbital speed exactly matches that of the Earth’s rotation, the satellite stays above the same point at all times, in a geostationary(link is external) orbit. This is useful for communications and weather monitoring satellites Satellite platforms for electro-optical (E/O) imaging systems are usually placed in a sun-synchronous(link is external), low-earth orbit (LEO) so that images of a given place are always acquired at the same local time (Figure 2.02). The revisit time for a particular location is a function of the individual platform and sensor, but generally it is on the order of several days to several weeks. While orbits are optimized for time of day, the satellite track may not always coincide with cloud-free conditions or specific vegetation conditions of interest to the end-user of the imagery. Therefore, it is not a given that usable imagery will be collected on every sensor pass over a given site

Satellite orbits: definition of terms (left), sun-synchronous orbit (right)

Figure 2.02: Satellite orbits: definition of terms (left), sun-synchronous orbit (right).

SOURCE: Campbell, 2007.

Aircraft often have a definite advantage because of their mobilization flexibility. They can be deployed wherever and whenever weather conditions are favorable. Clouds often appear and dissipate over a target over a period of several hours during a given day. Aircraft on site can respond with a moment’s notice to take advantage of clear conditions, while satellites are locked into a schedule dictated by orbital parameters. Aircraft can also be deployed in small or large numbers, making it possible to collect imagery seamlessly over an entire county or state in a matter of days or weeks simply by having lots of planes in the air at the same time.

Aircraft platforms range from the very small, slow, and low flying (Figure 2.03), to twin-engine turboprop and small jets capable of flying at altitudes up to 35,000 feet. Unmanned platforms (UAVs) are becoming increasingly important, particularly in military and emergency response applications, both international and domestic. Flying height, airspeed, and range are critical factors in choosing an appropriate remote sensing platform, and you will learn about this in more detail later in the lesson. Modifications to the fuselage and power system to accommodate a remote sensing instrument and data storage system are often far more expensive than the cost of the aircraft itself. While the planes themselves are fairly common, choosing the right aircraft to invest in requires a firm understanding of the applications for which that aircraft is likely to be used over its lifetime.

Image of a Helio Courier

Figure 2.03: Helio Courier.

SOURCE: Fugro EarthData.

Image of a Cessna Conquest

Figure 2.04: Cessna Conquest.

SOURCE: Fugro EarthData.

The scale and footprint of an aerial image is determined by the distance of the sensor from the ground; this distance is commonly referred to as the altitude above the mean terrain (AMT). The operating ceiling for an aircraft is defined in terms of altitude above mean sea level. It is important to remember this distinction when planning for a project in mountainous terrain. For example, the National Aerial Photography Program(link is external) (NAPP) and the National Agricultural Imagery Program(link is external) (NAIP) both call for imagery to be acquired from 20,000 feet AMT. In the western United States, this often requires flying much higher than 20,000 feet above mean sea level. A pressurized platform such as the Cessna Conquest (Figure 2.04) would be suitable for meeting these requirements.

With airborne systems, the flying height is determined on a project-by-project basis depending on the requirements for spatial resolution, GSD, and accuracy. The altitude of a satellite platform is fixed by the orbital considerations described above; scale and resolution of the imagery are determined by the sensor design. Medium resolution satellites, such as Landsat, and high-resolution satellites, such as GeoEye, orbit at nearly the same altitude, but collect imagery at very different ground sample distance (GSD).

REMOTE SENSING BASICS

Remote Sensing Basics

What is a Sensor?

A sensor detects physical variations in the world, e.g. light, temperature, radio waves, sound, magnetic fields. Example of humans senses are sight, sound, smell, touch and taste. Out of our senses, three of these are remote senses: sight, sound and smell. Our visual system is an example of a remote sensing system. The photosensitive cells in our eyes known as the cones and the rods detect visible light. Another common sensor that everyone is familiar with is a camera. Similar to our eyes, cameras are also examples of remote sensors that detect light.

Passive vs Active Remote Sensing

Passive

There are two primary types of remote sensing, active and passive. In the examples above of human vision and cameras, the energy being detected is naturally reflected energy. These are both examples of Passive Remote Sensing.Passive sensors detect natural energy or radiation that is emitted or reflected by objects. Reflected sunlight is the most common source of energy measure by passive remote sensor. A camera used without a flash is one of the most common examples of a passive sensor. Many satellites carry passive remote sensor to detect the intensity of electromagnetic radiation reflected or emitted from Earth’s surfaces.


Passive


In Active Remote Sensing the system provides it’s own energy. An active sensor emits radiation in the direction of the object being studied. The sensor then detect and measures the radiation that is reflected back from the object or surface. A camera used with a flash is an example of an active remote sensing system. Other common examples of active remote sensing are Radar and Lidar (light detection and ranging).

Platforms

In order for a sensor to collect and record energy reflected or emitted from a target or surface, it must reside on a stable platform. There are a variety of platforms types. The three main categories of platforms are as follow:

Ground Based Platforms

There are a variety of ground based platforms used in remote sensing. Ground based platforms can include sensors in hand held devices, mounted on tripods and even on agricultural equipment. Sometimes ground based sensors are used to calibrate airborne and satellite acquired data.

Aerial platforms

Aerial platforms include all platforms that are located above the Earth’s surface. The most common type of aerial platforms are fixed-wing aircrafts. Sensors can also be mounted on helicopters, balloons and kites. Recently Unmanned Aircraft Systems or UAS are being used to collect remote sensed data. A UAS is any aircraft that does not have a pilot on board and is controlled remotely.

Satellite platforms

Remote sensing satellites have been around for over 40 years and are used to measure a a variety of phenomena. There are a wide variety of satellites that vary in size and orbit. Satellites allow for repeat coverage of the Earth’s surface on a continuing basis.

The term “remote sensing” is a relatively new term and was first used to describe the field in the 1960s. While the term remote sensing wasn’t coined until the mid twentieth century, remote sensing first began nearly 150 years ago. Aerial photography is the earliest form of remote sensing. This began with the invention of the camera in the 1800s. The first successful photographs were produced in the early 1800s by French inventor Nicéphore Niépce. Soon after the development of photography people became interested in taking aerial photographs. The earliest aerial photographs were taken from balloons.

In 1850 Gaspard-Félix Tournachon more commonly known by his pseudonym Nadar, captured the first aerial photograph. Using a hot air balloon, Nadar produced the first successful aerial photograph of a French village in 1858. Unfortunately none of these early aerial photographs exist today. The oldest aerial photograph that has survived was taken in Boston in 1860 by James Wallace Black. Nadar’s earliest surviving aerial image was taken from a balloon above Paris in 1866.

In the early 20th century remote sensing images were captured using kites and cameras mounted on pigeons. In Europe carrier pigeons were already being used in military communication and aerial reconnaissance was an appealing application. Small light weight cameras were attached to the birds and photos were automatically taken using a timing mechanism. The pigeon photography was successful but didn’t become widely used due to the rapid development of aviation technology.

In 1906 professional photographer George Lawrence used a string of kites to raise a 49 pound camera 1000 feet in the air to capture the devastation of the earthquake in San Fransisco. The steel kite line carried an electric current to remotely trigger the shutter. The famous photograph “San Francisco in Ruins” was taken 6 weeks after the earthquake and subsequent fires in San Francisco.

San Francisco in Ruins

“San Francisco in Ruins,” by George Lawrence 1906

Aerial Photography in the 20th Century

The first aerial photographs taken from an airplane were in 1909, by Wilbur Wright. By the first World War, cameras mounted on airplanes provided aerial views of large surface areas that proved invaluable in military reconnaissance. By World War II airplanes were commonly equipped with cameras, in fact allied forces recruited a team of experts to review millions of stereoscopic aerial images to detect hidden Nazi rocket bases. During the Cold War the use of aerial reconnaissance increased with U-2 aircraft flying at ultra-high altitude (70,000 ft) to capture imagery. Aerial photography grew quickly following the war and was soon employed for a variety of purposes. These new photographs provided people a realistic vantage of the world few had seen before. Aerial photography was a much faster and cheaper way to produce maps compared to traditional ground surveys. In the United States aerial photography was used for farm programs beginning in the Dust Bowl Era of the 1930s with the passing of the Agricultural Adjustment Act. Aerial photography remained the primary tool for depicting the Earth’s surface until the early 1960s.

Satellites

The development of satellite based remote sensing began with the “space race” in the 1950s and 1960s. In 1957 the Soviet Union launched Sputnik 1,the world’s first artificial satellite. The United States followed in 1960 with the successful launch of Explorer 1. The next decades brought about rapid developments in satellites and imaging technology. The first successful meteorological satellite (TIROS-1) was launched in 1960 and in 1972 Landsat 1, the first earth resource satellite was launched. There are currently over 3,600 satellite orbiting the Earth, but only 1000 are operational. Of these satellite, well over 100 are earth observing satellites that carry a variety of different sensors to measure and capture data about the Earth.

Unmanned Aircraft Systems (UAS)

UASUnmanned Aircraft Systems (UAS) or more commonly known as drones, are any type of aircraft that do not have a human pilot aboard. UAS can be controlled by remote control with a pilot on the ground or autonomously by on board computers. Unmanned aircraft can be used to obtain remotely sensed imagery or data for a variety of application including: Fire and natural disaster monitoring, wildlife observations and vegetation measurements. UAS can be deployed relatively quickly, repeatedly and at low altitudes and can acquire very high resolution data. In the United States the Federal Aviation Administration (FAA) is responsible for regulating UAS use. It is currently legal for hobbyist to fly small UAS (less than 55 lbs) under 400 ft. Those interested in using UAS for research purposes must obtain permission from the FAA to fly.

PHOTOGRAMMETRY

PHOTOGRAMMETRY

DEFINITION

The science, art, and technology of obtaining reliable information from photographs
Two areas of photogrammetric specialization

  • Metrical
  • Interpretative

    TYPES OF PHOTOGRAMMETRY

    Metrical

  • Surveying applications
  • Applications used to determine distances, elevations, areas, volumes, and cross-sections to compile topographical maps from photographic measurements
  • Primarily uses aerial photos; sometimes uses terrestrial photos

    Interpretative

  • Involves recognizing objects from photographic images
  • Uses images created from satellite imagery which senses energy wavelengths
  • Forms basis for remote sensing (art or science of gathering information about an object or image without actually coming into physical contact)
      As comedian Steven Wright says:
      Every so often, I like to stick my head out the window, look up, and smile for a satellite picture.

    PROFESSIONS THAT USE PHOTOGRAMMETRY

  • Geology/archeology
  • Forestry/agriculture
  • Military/artificial intelligence
  • Surveying/mapping

    REASONS FOR USE OF PHOTOGRAMMETRY

    Advantages

  • Cover areas quickly
  • Low costs
  • Easy to obtain/access information from air
  • Illustrates great detail

    AERIAL CAMERAS

    Information is gathered primarily from aerial cameras

  • Single-lens frame
    • lens
    • filter
    • camera cone
    • shutter
    • diaphragm
    • fiducial marks

    AERIAL PHOTOGRAPHS

    Terms

  • Principal point
  • Calibration

    Aerial photograph types

  • Vertical
  • Oblique

    Most aerial photos have to calibrated to ground control

    AERIAL PHOTOGRAPHS

    Parallax

  • Apparent motion of an object due to viewer’s movement

    Factors to consider with aerial photos

  • Scale (horizontal and vertical)
  • Focal Length
  • Flying Height
  • Parallax errors
  • Relief displacement
  • Triangulation
  • Photo overlap

    PHOTOGRAMMETRY

    Stereoscopic plotters

  • Used to compile topographic maps from overlapping photographs
  • Two types
    • Optical Projection
    • Mechanical Projection

    Photogrammetric ground control

  • Traverse
  • Triangulation
  • Trilateration

    REMOTE SENSING

    Remote Sensing

  • Definition
  • Sensors/scanners
    • Operate on same principal as human eye, yet can see broader range of imagery
    • Multispectral scanner (MSS)
    • Radiometers
    • Side-looking airborne radar
    • Passive microwave

    PRINCIPLES OF PHOTOGRAMMETRIC DATA

    Scanners utilize the electromagnetic spectrum

  • Uses X-rays, visible light rays, radio waves
  • Primary colors
    • Red
    • Green
    • Blue
    • 0.4-0.7 micrometers

    PHOTOGRAMMETRY

    Type of satellites

  • Landsat TM
  • Landsat MSS
  • Spot
  • AVHRR

    Errors sources in photogrammetry

  • Scale
  • Inaccurate calibration/orientation
  • Faulty assumptions/presumptions

    PHOTOGRAMMETRY QUIZ

  • List advantages of photogrammetry
  • Types of satellite images
  • Range of wavelengths used in most scanners
  • Definition of remote sensing
  • Two types of photogrammetry
  • HORIZONTAL AND VERTICAL CURVES


    Types of Curves – Horizontal and Vertical

    Definition:

    Curves are provided whenever a road changes its direction from right to S (vice versa) or changes its alignment from up to down (vice versa). Curves are a critical! element in the pavement design. They are provided with a maximum speed limit that should lie followed very strictly. Following the speed limit becomes essential as the exceed in speed may lead to the chances of the vehicle becoming out of control while negotiating a turn and thus increase the odds of fatal accidents. Also, it is very necessary that appropriate safety measures be adopted at all horizontal and vertical curves to make the infrastructure road user friendly and decrease the risks of hazardous circumstances.

    The low cost safety measures that can be adopted at curves included chevron signs, delineators, pavement markings, flexible posts, fluorescent strips, road safety barriers, rumble strips etc.

    Types of Curves

    There are two types of curves provided primarily for the comfort and ease of the motorists in the road namely:

    1. Horizontal Curve
    2. Vertical Curve

    Horizontal Curves

    Horizontal curves are provided to change the direction or alignment of a road. Horizontal Curve are circular curves or circular arcs. The sharpness of a curve increases as the radius is decrease which makes it risky and dangerous. The main design criterion of a horizontal curve is the provision of an adequate safe stopping sight distance.

    Types of Horizontal Curve:

    Simple Curve:

    A simple arc provided in the road to impose a curve between the two straight lines.

    Compound Curve:

    Combination of two simple curves combined together to curve in the same direction.

    Reverse Curve:

    Combination of two simple curves combined together to curve in the same direction.

    Transition or Spiral Curve:

    A curve that has a varying radius. Its provided with a simple curve and between the simple curves in a compound curve.

    While turning a vehicle is exposed to two forces. The first force which attracts the vehicle towards the ground is gravity. The second is centripetal force, which is an external force required to keep the vehicle on a curved path. At any velocity, the centripetal force would be greater for a tighter turn (smaller radius) than a broader one (larger radius). Thus, the vehicle would have to make a very wide circle in order to negotiate a turn

    This issue is encountered when providing horizontal curves by designing roads that are tilted at a slight angle thus providing ease and comfort to the driver while turning. This phenomenon is defined as super elevation, which is the amount of rise seen on a given cross-section of a turning road, it is otherwise known as slope.

    Vertical Curves

    Vertical curves are provided to change the slope in the road and may or may not. be symmetrical. They are parabolic and not circular like horizontal curves. Identifying the proper grade and the safe passing sight distance is the main design criterion of the vertical curve, iln crest vertical curve the length should be enough to provide safe stopping sight distance and in sag vertical curve the length is important as it influences the factors such as headlight sight distance, rider comfort and drainage requirements.

    Types of Vertical Curve:

    Sag Curve

    Sag Curves are those which change the alignment of the road from uphill to downhill,

    Crest Curve/Summit Curve

    Crest Curves are those which change the alignment of the road from downhill to uphill. In designing crest vertical curves it is important that the grades be not] too high which makes it difficult for the motorists to travel upon it.

    TOTAL STATION SURVEYING

    What is a Total Station?

    Total station is a surveying equipment combination of Electromagnetic Distance Measuring Instrument and electronic theodolite. It is also integrated with microprocessor, electronic data collector and storage system. The instrument can be used to measure horizontal and vertical angles as well as sloping distance of object to the instrument.


    Capability of a Total Station:

    Microprocessor unit in total station processes the data collected to compute:

    1. Average of multiple angles measured.
    2. Average of multiple distance measured.
    3. Horizontal distance.
    4. Distance between any two points.
    5. Elevation of objects and
    6. All the three coordinates of the observed points.

    Data collected and processed in a Total Station can be downloaded to computers for further processing.

    Total station is a compact instrument and weighs 50 to 55 N. A person can easily carry it to the field. Total stations with different accuracy, in angle measurement and different range of measurements are available in the market. Figure below shows one such instrument manufactured by SOKKIA Co. Ltd. Tokyo, Japan.

    Parts of total station

    Fig: Parts of total station

    Brief Description of Important Operations of Total Station:

    Distance Measurement:

    Electronic distance measuring (EDM) instrument is a major part of total station. Its range varies from 2.8 km to 4.2 km. The accuracy of measurement varies from 5 mm to 10 mm per km measurement. They are used with automatic target recognizer. The distance measured is always sloping distance from instrument to the object. Angle Measurements: The electronic theodolite part of total station is used for measuring vertical and horizontal angle. For measurement of horizontal angles any convenient direction may be taken as reference direction. For vertical angle measurement vertical upward (zenith) direction is taken as reference direction. The accuracy of angle measurement varies from 2 to 6 seconds.

    Data Processing :

    This instrument is provided with an inbuilt microprocessor. The microprocessor averages multiple observations. With the help of slope distance and vertical and horizontal angles measured, when height of axis of instrument and targets are supplied, the microprocessor computes the horizontal distance and X, Y, Z coordinates. The processor is capable of applying temperature and pressure corrections to the measurements, if atmospheric temperature and pressures are supplied.

    Display:

    Electronic display unit is capable of displaying various values when respective keys are pressed. The system is capable of displaying horizontal distance, vertical distance, horizontal and vertical angles, difference in elevations of two observed points and all the three coordinates of the observed points.

    Electronic Book:

    Each point data can be stored in an electronic note book (like compact disc). The capacity of electronic note book varies from 2000 points to 4000 points data. Surveyor can unload the data stored in note book to computer and reuse the note book.


    Use of Total Station

    The total station instrument is mounted on a tripod and is levelled by operating levelling screws. Within a small range instrument is capable of adjusting itself to the level position. Then vertical and horizontal reference directions are indexed using onboard keys. It is possible to set required units for distance, temperature and pressure (FPS or SI). Surveyor can select measurement mode like fine, coarse, single or repeated.

    When target is sighted, horizontal and vertical angles as well as sloping distances are measured and by pressing appropriate keys they are recorded along with point number. Heights of instrument and targets can be keyed in after measuring them with tapes. Then processor computes various information about the point and displays on screen.

    This information is also stored in the electronic notebook. At the end of the day or whenever electronic note book is full, the information stored is downloaded to computers.

    The point data downloaded to the computer can be used for further processing. There are software like auto civil and auto plotter clubbed with AutoCad which can be used for plotting contours at any specified interval and for plotting cross-section along any specified line.

    Advantages of Using Total Stations

    The following are some of the major advantages of using total station over the conventional surveying instruments:

    1. Field work is carried out very fast.
    2. Accuracy of measurement is high.
    3. Manual errors involved in reading and recording are eliminated.
    4. Calculation of coordinates is very fast and accurate. Even corrections for temperature and pressure are automatically made.
    5. Computers can be employed for map making and plotting contour and cross-sections. Contour intervals and scales can be changed in no time.

    However, surveyor  should check the working condition of the instruments before using. For this standard points may be located near survey office and before taking out instrument for field work, its working is checked by observing those standard points from the specified instrument station.

    TRAVERSING AND TRIANGULATION SURVEY

    Contents

        »  Surveying Methods
              •   Triangulation
                  ~ Explaining Some Jargon – Angular Measurement
              •   Trilateration
              •   Traversing


    Surveying Methods


    Triangulation

    In the past it was difficult to accurately measure very long distances, but it was possible to accurately measure the angles between points many kilometres apart, limited only by being able to see the distant beacon.  This could be anywhere from a few kilometres, to 50 kilometres or more.

    Triangulation is a surveying method that measures the angles in a triangle formed by three survey control points.  Using trigonometry and the measured length of just one side, the other distances in the triangle are calculated.  The shape of the triangles is important as there is a lot of inaccuracy in a long skinny triangle, but one with base angles of about 45 degrees is ideal.

    Each of the calculated distances is then used as one side in another triangle to calculate the distances to another point, which in turn can start another triangle.  This is done as often as necessary to form a chain of triangles connecting the origin point to the Survey Control in the place needed.  The angles and distances are then used with the initial known position, and complex formulae, to calculate the position (Latitude and Longitude) of all other points in the triangulation network.

    Although the calculations used are similar to the trigonometry taught in high school, because the distance between the survey points is generally long (typically about 30 kilometres) the calculations also allow for the curvature of the Earth.

    The measured distance in the first triangle is known as the ‘Baseline’ and is the only distance measured; all the rest are calculated from it and the measured angles.  Prior to the 1950s, this initial baseline distance would have to be very carefully measured with successive lengths of rods whose length were accurately known.  This meant that the distance would be relatively short (maybe a kilometre or so) and it would be in a reasonably flat area, such as a valley or plain.  The triangles measured from it gradually increased in size, and up onto the hilltops where distant points could be seen easily.


    diagram showing triangulation calculations

    Figure 9:  Triangulation Network


    The angles in the triangles are measured using a theodolite, which is an instrument with a telescope connected to two rotating circles (one horizontal and one vertical) to measure the horizontal and vertical angles.  A good quality theodolite used for geodetic surveys would be graduated to 0.1 second of an arc and an angle resulting from repeated measurements would typically have an accuracy of about 1 second of arc, which is equivalent to about 5 cm over a distance of 10 kilometres.

    In triangulation the vertical angles are not needed, but they can be used to measure the difference in height between the points.


    Explaining Some Jargon – Angular Measurement

    There are 360 degrees in a full circle.  One degree contains 60 minutes and each minute contains 60 seconds.  So there are 3,600 seconds in a degree and 1,296,000 seconds in a full circle.  These seconds or minutes are often referred to as ’seconds of arc’ or ’minutes of arc’ to distinguish them from seconds and minutes of time.


    link to wikipedia: http://en.wikipedia.org/wiki/File:Theodolite_vermeer.png

    Figure 10:  Theodolite Schematic

    Figure 11:  A Theodolite


    Trilateration

    In the 1950s, accurate methods of measuring long distances (typically 30 to 50 km) were developed.  They used the known speed of light (299,792.458 km per second) and the timed reflection of a microwave or light wave along the measured line.  Known as Electromagnetic Distance Measurement (EDM), the two initial types of instrument were the ‘Tellurometer’, which used a microwave, and ‘Geodimeter’, which used a light wave.

    The distances in a triangle could then be measured directly instead of calculating them from the observed angles.  If needed the angles could be calculated.  The process of calculating positions through the chain of triangles is then the same as for triangulation.

    Sometimes both angles and distances were measured in some triangles to check on the observations and improve the accuracy of the calculations.


    Figure 12:  Trilateration Network


    Figure 13:  A Tellurometer

    link to the USA Geological Servise - USGS

    Figure 14:  A Model 8 Geodimeter


    The early EDM instruments could measure long distances with an accuracy of about 5 parts per million (i.e. 5 mm for every km or to 150 mm over a 30 km line), but later versions were more accurate, able to measure with an accuracy of about 1 part per million (1 mm per kilometre or 30 mm over a 30 km line)

    These days there are also many types of accurate and compact EDM instruments integrated with an electronic theodolite and known generically as a ‘Total Station’.  These instruments can also measure with an accuracy of about 1 part per million, but generally only for shorter lines of about one kilometre.


    Figure 15:  Total Station Theodolite


    Traversing

    Triangulation and Trilateration are difficult and sometimes impossible in flat country where there are not many hills.  This is often the situation in outback areas of Australia.

    With EDM this problem can be minimised by measuring the distances and angle between successive survey control points.  With a known starting position and orientation (or two known starting positions) repeating this process through a chain of points allows the position of each point to be calculated as for Triangulation and Trilateration.

    However, in a traverse, if a mistake is made, it may not be obvious, so these traverses generally close back onto their starting point to form a loop, or finish on another known position.  The difference between the known finishing position and the calculated position for this point is the misclose and indicates the accuracy of the traverse measurements and calculations.


    Figure 16:  Traverse Diagram


    For small projects Traversing is often used with ‘Total Station’ equipment.  Variations on triangulation and trilateration are also often used on small surveys, particularly to measure to inaccessible points.